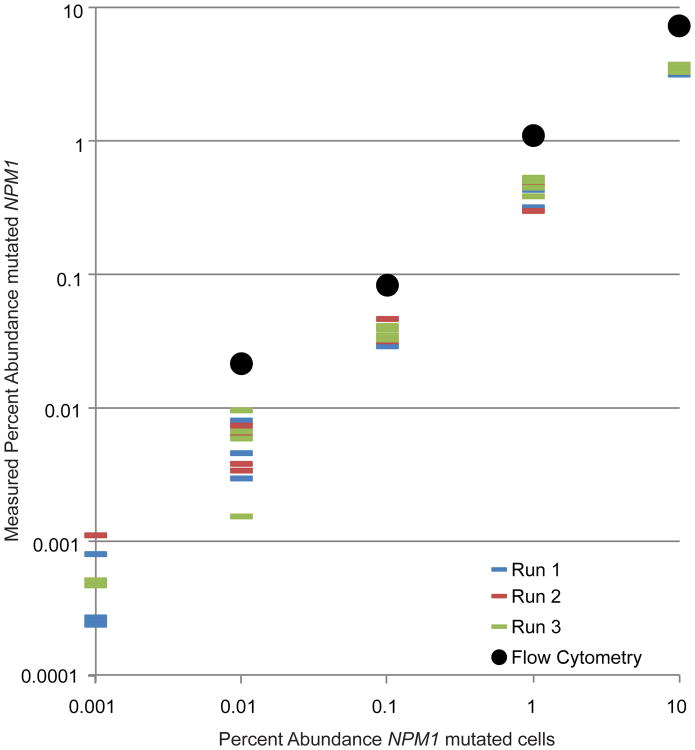
Figure 1. Next-generation sequencing for minimal residual disease detection of NPM1 mutations.
Comparison of next-generation sequencing (dash) versus flow cytometry (circle) results using cell mixtures of the NPM1-mutation positive OCI-AML3 cell line diluted into normal marrow. Graph depicts four technical replicates for each next-generation sequencing sample, with each set of technical replicates sequenced on three separate sequencing runs (red, green, or blue). Intra- and inter-run reproducibility data are shown in Table 2.

