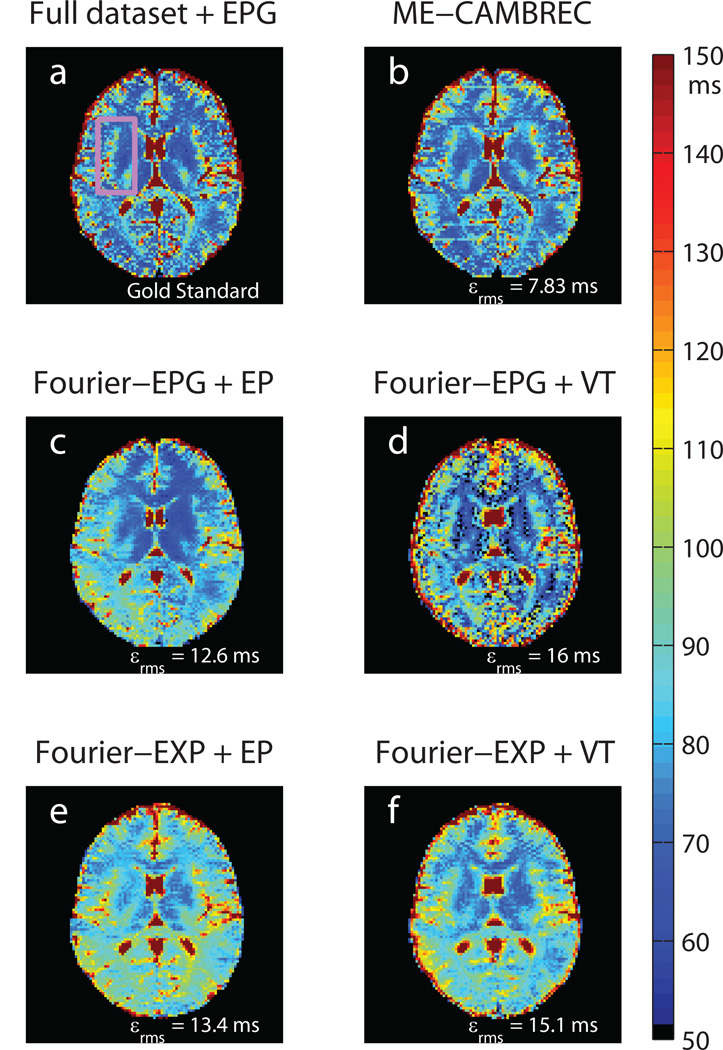
Fig 5. Reconstructed T2 maps in healthy human brain.
The pink rectangle in the top-left fully sampled image (a) denotes the ROI used to measure RMS error. Note the asymmetry and systematic overestimation of T2 in Fourier-reconstructed EP protocols (c, e) as well as the edge enhancement and ghosting artifacts visible in the Fourier-reconstructed VT protocols (d,f). All accelerated methods used 1/6.6th of the full dataset (NT = 16); data fit to the exponential model was acquired with a prescribed refocusing flip angle of 180° and was compared to a fully sampled dataset at that flip angle. All other images were derived from data acquired using a prescribed flip angle of 120°.

