Figure 1.
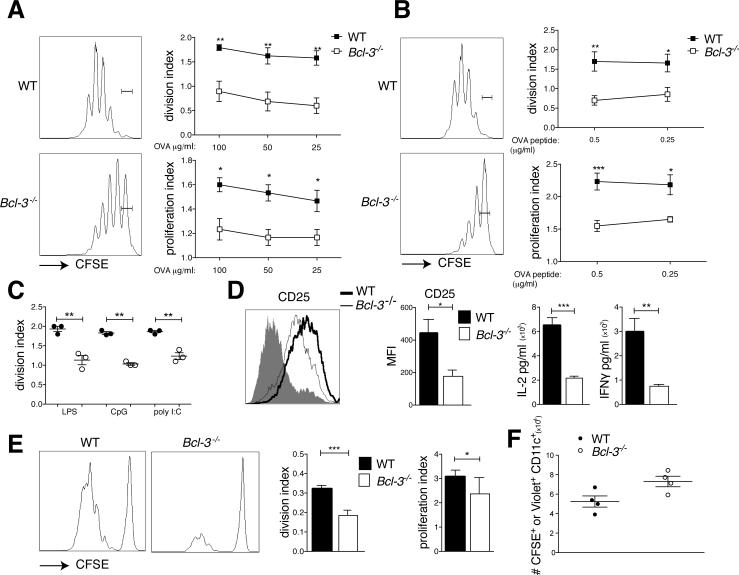
Bcl-3 is required for efficient BMDC-mediated CD4 priming in vitro and in vivo. (A) WT and Bcl3−/− BMDCs were loaded with different doses of ovalbumin (OVA) and stimulated with LPS (100ng/ml) overnight (o.n.), then co-cultured with CFSE-labeled OT-II T cells for 72h. T cells were analyzed by flow cytometry after staining and gating for CD4. Representative FACS plots and proliferation and division indices (FloJo) are shown; mean ± SEM; n=5/group. (B) WT and Bcl-3−/− BMDCs were stimulated with LPS o.n., pulsed for 3h with different doses of OVA-peptide, and co-cultured for 72h with CFSE-labeled OT-II T cells. T cells were analyzed by flow cytometry after staining and gating for CD4 and data presented as in (A) (n=4/group). (C) WT and Bcl3−/− BMDCs were loaded with 100μg/ml OVA and stimulated with LPS (100ng/ml), CpG (10μg/ml) or poly I:C (100μg/ml) o.n., then co-cultured with CFSE-labeled OT-II T cells for 72h. T cells were analyzed by flow cytometry after staining and gating for CD4. Division index (FloJo) is shown; mean ± SEM; n=3/group. (D) WT and Bcl3−/− BMDCs were treated as in (A) (100μg/ml OVA) and incubated with OT-II T cells for 72h. T cells were analyzed for CD25 after staining for CD4 and CD25 and gating on CD4. A representative mean florescent intensity (MFI) plot and summary analysis are shown in left two panels. The shaded area represents naïve cells (controls). Cell culture supernatants were analyzed for IL-2 and IFNγ with CBA, shown in right two panels. Mean ± SEM; n=3/group. (E) 5×10⁶ CFSE-labeled CD45.2 OT-II T cells were injected i.v. into CD45.1 congenic mice. 24h later animals were injected i.p. with 1×10⁶ OVA-loaded (100μg/ml) and LPS stimulated WT and Bcl-3−/− BMDCs. Splenocytes were isolated 72h later, stained and gated for CD45.2 and CD4 and analyzed by flow cytometry. Data shown as in (A); n=10 mice/group based on 2 experiments. (F) LPS-stimulated and CFSE-labeled (WT) and cell trace violet-labeled (Bcl-3−/−) BMDCs were co-injected (5×10⁶/each group) into WT mice i.p.. 18h later spleens were harvested and cells stained and gated for CD11c. Absolute numbers of CFSE+CD11c+ and violet+CD11c+ were determined and data are shown as mean ±SEM; n=4 mice/group; an additional experiment yielded similar data. *P<0.05, **P<0.01 and ***P<0.0001.

