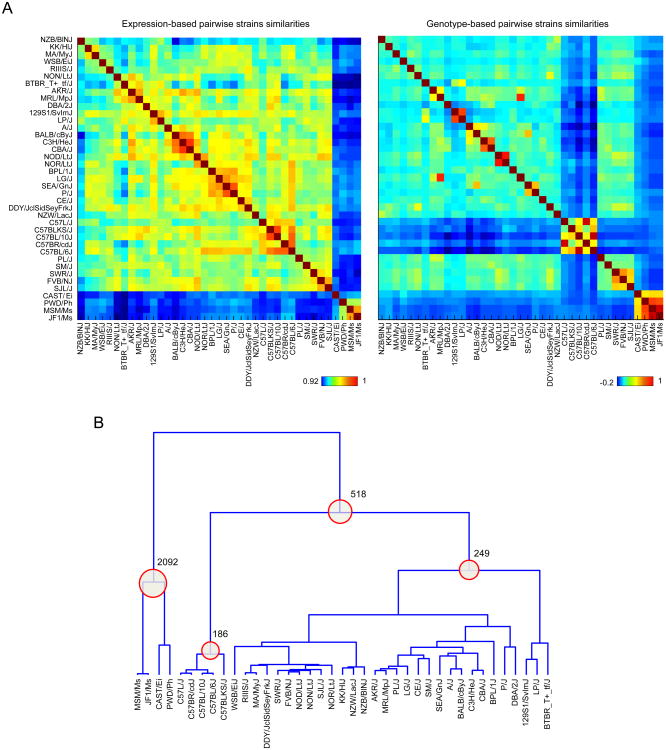
Figure 2. Expression-based and genotype-based strain similarities.
(A) The similarity between each pair of strains was computed from genotype data or gene expression data using Spearman correlation. For expression data, all expressed genes (expressed in either cell type) were used in the computation. For genotype data, all variants satisfying the initial criteria (MAF > 0.05 and missing rate < 10%) were used. Each element in the heatmap (matrix) represents the strength of the similarity between a pair of strains. Expression-based and genotype-based similarity heatmaps follow the same row and column order. (B) The dendrogram was derived from a genotype-based similarity matrix using hierarchical agglomerative clustering. To account for strain-based scale differences between the distribution of similarities, pairwise strain distances for constructing the dendrogram were derived from ranked pairwise similarities for each strain. Each internal node in the dendrogram was used to define two groups (clusters) of strains—represented by descending leaves, and non-descending leaves. Numbers of differentially expressed genes (DEGs) (defined using t-test and a 5% FDR threshold) for groupings that yielded > 100 DEGs at 5% FDR are shown.

