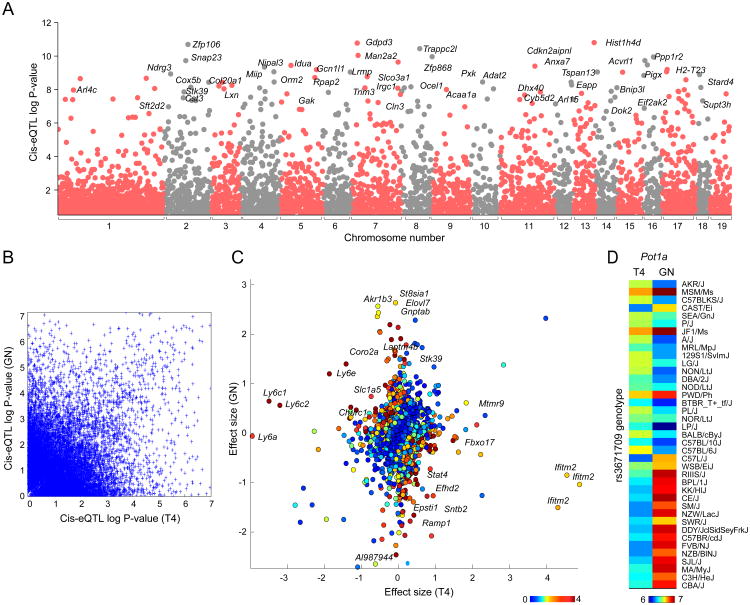
Figure 3. GN and T4 joint-discovered and cell-specific cis-eQTLs.
(A) Association p-values for each transcript and all of its cis SNPs (1Mb from the TSS) were computed using the Wilcoxon rank sum test. Association statistics were computed from both T4 and GN data (“joint analysis”). Each point represents a transcript; only the best association for each transcript is shown. (B) For each cell type, association p-values for SNP-transcript pairs were computed separately. The association p-values are shown for the best GN SNP and best T4 SNP for each transcript (i.e., each transcript is represented twice). (C) Cell-specific SNP-transcript association p-values were computed by testing the significance of an interaction term (see Methods). Effect sizes for the best SNP for each transcript and each cell type were computed as the mean difference between strains with alternative and reference alleles. Colors depict the strength (negative log10 p-value) of cell-specificity at gene-level. Figure shows effect size and association strengths for the best SNP for all expressed genes. (D) Heatmap shows the expression levels for the gene Pot1a in GN and T4. Strains are sorted based on the genotype of the best SNP for Pot1a.

