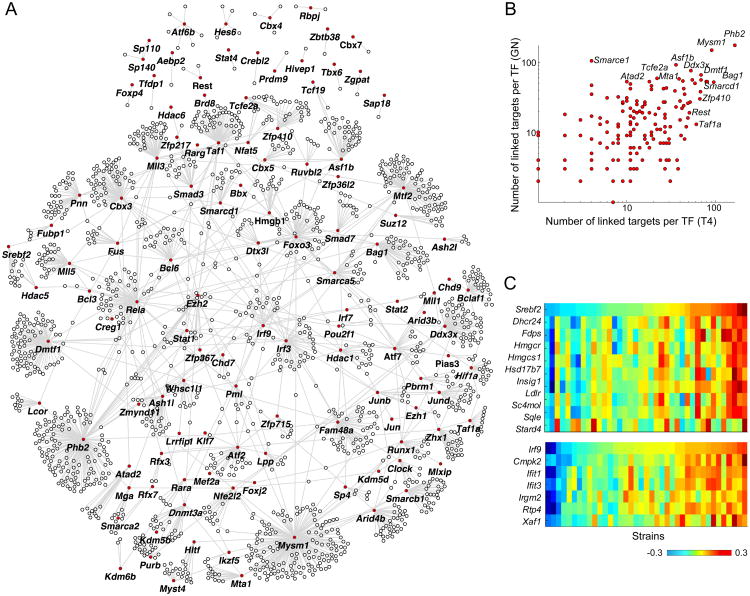
Figure 4. Analysis of gene co-expression in mouse.
(A) Overall network showing TF-target links discovered from T4 and GN data (“joint network”; for visualization purpose, figure only shows a limited set of the strongest links). TFs are marked in red. (B) Figure shows the node degree for each TF in T4 (x-axis) and GN (y-axis) networks. (C) Expression heatmaps for selected regulators and their inferred targets; top heatmap shows data for Srebf2 and nine of its target, bottom heatmap shows data for Irf9 and six of its targets (only targets that overlap with the Ontogenet predictions based on ImmGen data are shown).

