
Figure 3. Linc-VLDLR expression and therapeutic response.
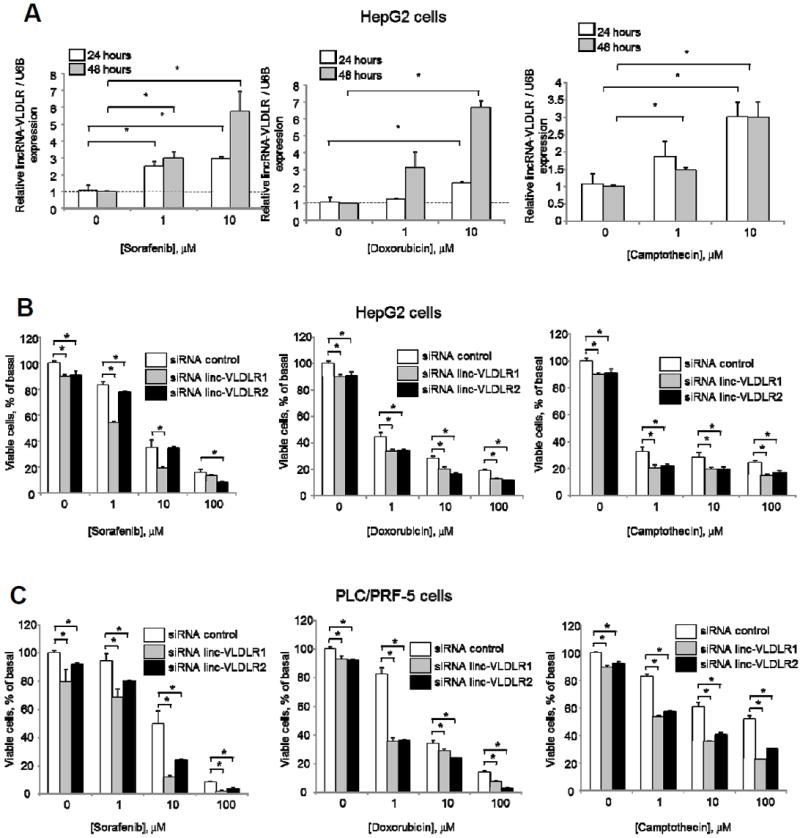
A. HepG2 cells were incubated with varying concentrations of sorafenib, doxorubicin or camptothecin for 24 or 48 hours. Linc-VLDLR expression was determined by qRT-PCR, normalized to that of RNU6B. and is represented relative to normalized expression in controls at each time point. B. HepG2 cells were transfected with siRNA to linc-VLDLR (siRNA VLDLR-1 or siRNA VLDLR-2) or non-targeting siRNA controls. Transfected cells were then incubated with varying concentrations of sorafenib, doxorubicin or camptothecin and cell viability was assessed after 48 hours. Bars represent the mean ± SEM of 3 separate studies. *, p < 0.05. C. PLC/PRF-5 cells were transfected with siRNA to linc-VLDLR (siRNA VLDLR-1 or siRNA VLDLR-2) or non-targeting siRNA controls. Transfected cells were then incubated with varying concentrations of sorafenib, doxorubicin or camptothecin and cell viability was assessed after 48 hours. Bars represent the mean ± SEM of 3 separate studies. *, p < 0.05.