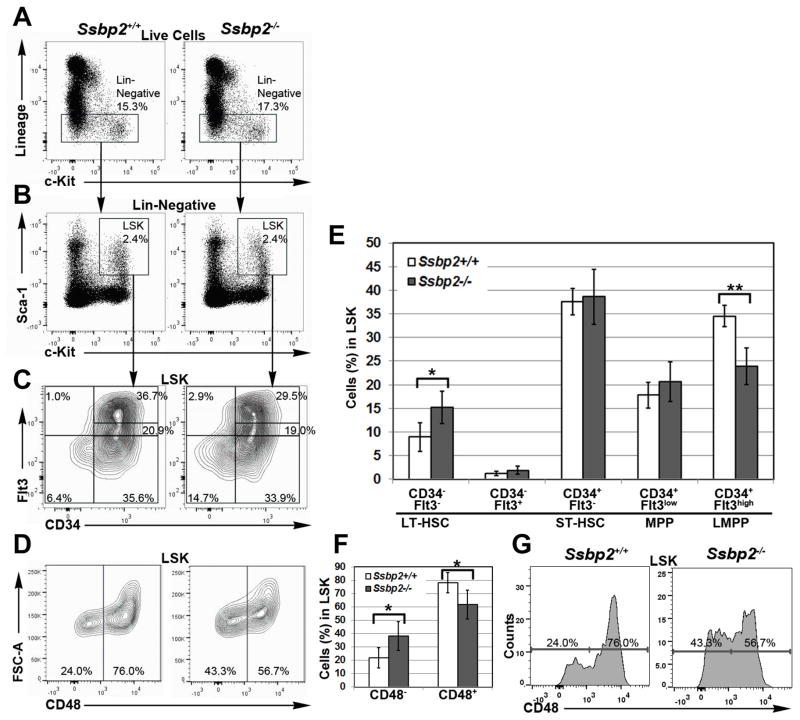
Fig 3. Ssbp2 deletion affects the frequency of HSPC subpopulations.
A. Frequency of Lin− cells is unaffected by Ssbp2−/− BM. A representative image of gating within live population for lineage-negative cells B. Frequency of LSK cells was unaffected by Ssbp2−/− BM. A representative image of c-Kit, Sca1 gating in Lin− cells. C and E. Frequency of LMPPs (Flt3hiCD34+ LSKs) is decreased in Ssbp2−/− BM. C. Representative flow cytometry analysis showing LT-HSCs (Flt3−CD34− LSKs), ST-HSCs (Flt3−CD34+ LSKs), MPPs (Flt3loCD34+ LSKs), and LMPPs (Flt3hiCD34+ LSKs) within LSKs in Ssbp2-null mice and their WT littermates. E. Frequency of LT-HSCs, ST-HSCs, MPPs and LMPPs within the LSK population in WT (n = 5) and null mice (n = 5). D, F and G. Frequency of CD48 cells is increased in Ssbp2−/− BM. D. Representative flow cytometry analysis showing CD48+ cells within LSKs in Ssbp2-null mice and their WT littermates. F. Frequency of CD48+ and CD48− population within the LSK compartment in WT (n = 5) and null mice (n = 5). G. Representative histogram for anti-CD48 staining. Note the increase in frequency in CD48− cells in null mice. Data in E and F represent mean ± S.D from age-matched WT (n = 5) and null mice (n = 5)*p<0.05) as determined by unpaired, two tailed t test between WT and Ssbp2−/− mice.

