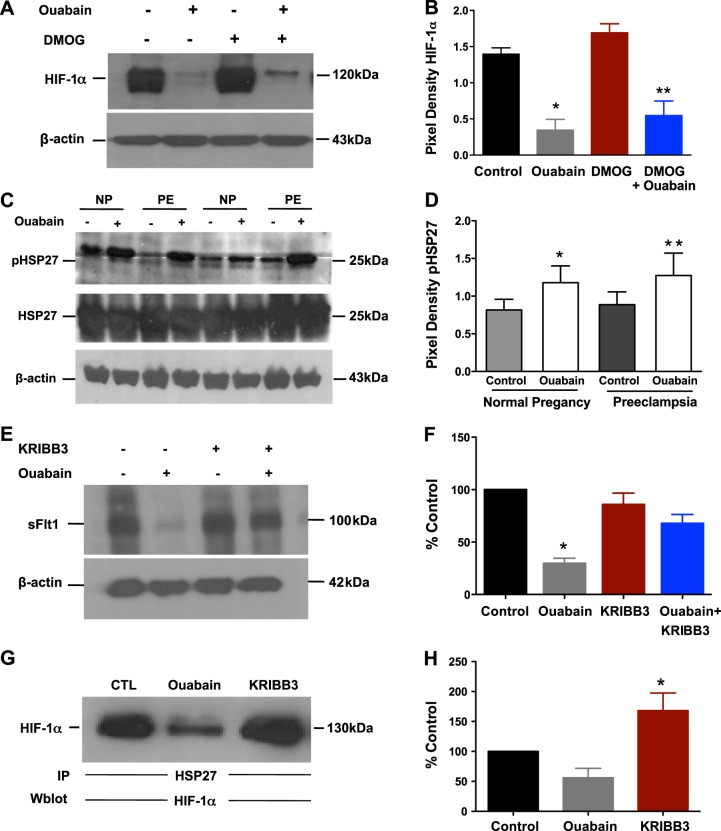
Figure 5.
Mechanisms of HIF inhibition. A) Western blot analysis of HIF-1α in normal explants (n=4) exposed to ouabain (500 nM) ± DMOG (100 μM). B) Quantification of Western blot. *P < 0.05 vs. control; **P < 0.05 vs. DMOG; Student's t test. C) Western blot analysis of explants for HSP27 and pHSP27 in control ± ouabain (n=6 NP and 6 PE). D) Quantification of pHP27 as a ratio of pHSP27/HSP27 for both groups. *P < 0.05 vs. control in normal pregnancy; **P < 0.05 vs. control in preeclampsia; Student's t test. E) Western blot analysis of sFlt1 in normal explants (n=3) exposed to ouabain (100 nM) ± KRIBB3 (500 nM). F) Quantification of Western blot. Data are presented as a percentage of the sFlt1 expression in control. *P < 0.05 vs. control; Student's t test. G) In coimmunoprecipitation studies, HSP27 was immunoprecipitated (IP) and then analyzed for HIF1-α in Western blot analysis. Normal explants (n=4, ouabain 100 nM and KRIBB3 500 nM). Data are presented as a percentage of the sFlt1 expression in control. H) Quantification of Western blot. *P < 0.05 vs. ouabain; Student's t test.

