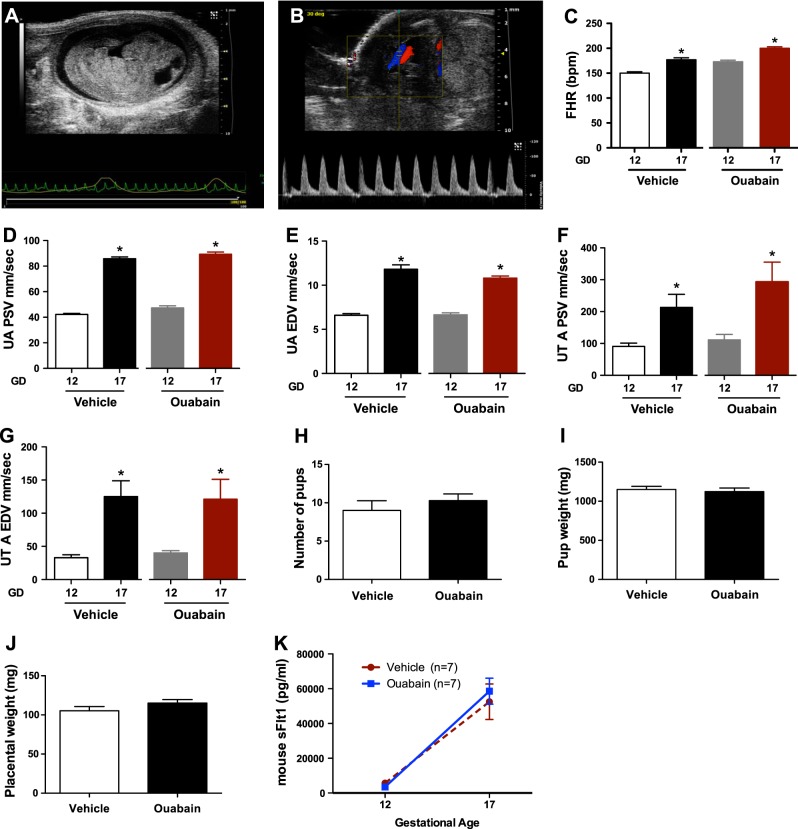
Figure 7.
Uteroplacental hemodynamics in normal pregnancy with ouabain therapy. A) Sagittal view of the mouse fetus at gestational d 12. B) The placental cord insertion is first identified by color Doppler. A waveform is obtained showing the peak systolic velocity (PSV) and end-diastolic velocity (EDV). C) Change in the fetal heart rate (FHR) at gestational d 12 and gestational d 17 among vehicle-injected (n=7) and ouabain-injected (n=7) mice. *P < 0.05 vs. gestational d 12; Student's t test. D, E) Change in the umbilical artery (UA) PSV (D) and EDV (E) at gestational d 12 and gestational d 17 among vehicle-injected (n=7) and ouabain-injected (n=7) mice. *P < 0.05 vs. gestational d 12; Student's t test. F, G) Change in the uterine artery (UT A) PSV (F) and EDV (G) at gestational d 12 and gestational d 17 among vehicle-injected (n=7) and ouabain-injected (n=7) mice. *P < 0.05 vs. gestational d 12; Student's t test. H–J) Number of pups (H), pup weight (I), and placental weight (J) among vehicle-injected and ouabain-injected mice. K) Plasma sFlt1 levels at gestational d 12 and gestational d 17 in vehicle-injected (n=7) and ouabain-injected (n=7) mice.

