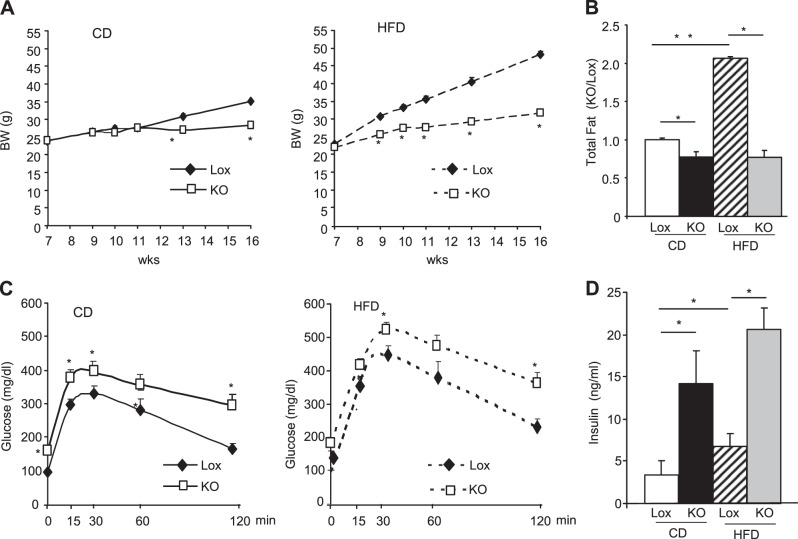
Figure 3.
TFAM deletion in adipose tissues decreases fat mass and triggers insulin resistance. A) Body weight of male control (Lox) and adipo-TFAM-KO (KO) mice on CD (left panel) or HFD (right panel). Data are means ± sem of 6–8 animals/group. *P < 0.05. B) Total fat mass was assessed by DEXA analysis of male Lox and KO mice on a CD or HFD at 24 wk of age. Data are means ± sem, normalized to Lox data (n=8/genotype). *P < 0.05. C) Intraperitoneal glucose test on male Lox and KO male on CD (left panel) or HFD (right panel) at 24 wk of age. *P < 0.05. Data are means ± sem of 6–8 samples/genotype. *P < 0.05. D) Insulin serum levels of male Lox and KO mice at 24 wk of age. Data are means ± sem of 6–8 samples/genotype. *P < 0.05.

