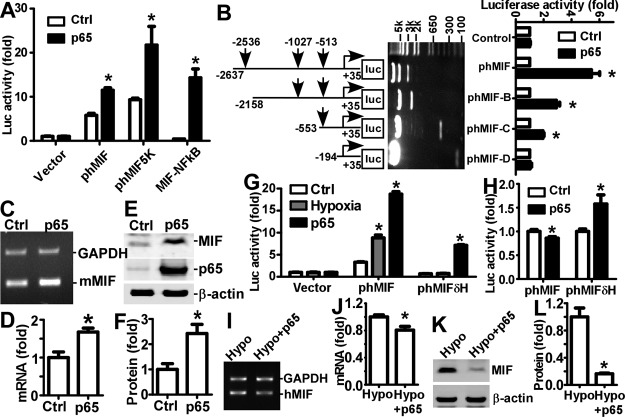
Figure 3.
Regulation of human MIF gene expression by NFκB signaling. A) HEK293 cells were cotransfected with MIF promoter plasmids and NFκB p65 expression plasmid or its backbone. Cells were harvested with passive lysis buffer and measured for luciferase activity. Firefly luciferase activity was normalized to Renilla luciferase activity for transfection efficiency control, and expressed as RLU to reflect the promoter activity. Values are expressed as means ± sd, n = 6. *P < 0.001 vs. controls; 2-way ANOVA with Bonferroni posttests. B) Schematic diagram of deletion plasmids containing different human MIF promoter fragments in front of the firefly luciferase reporter gene. Vertical arrows indicate starting location of the putative NFκB binding sites. Deletion plasmids were confirmed by sequencing and restriction enzyme digestion checking, and digested samples were analyzed on a 0.7% agarose gel. Vector size is 4.7 kb, and the MIF promoter fragment inserts range from ∼230 bp to 2.7 kb. Luciferase assay was performed as in A. Values are expressed as means ± sd, n = 6. *P < 0.001 vs. controls; 2-way ANOVA with Bonferroni posttests. C) N2A cells were transfected with NFκB expression plasmid. Total RNA was extracted from cells by Tri reagent, and semiquantitative RT-PCR was used to measure mouse MIF mRNA in N2A cells with mouse MIF gene-specific primers. GAPDH mRNA was used as the internal control. D) Quantification of C. Level of MIF mRNA is expressed as relative ratio to GAPDH. Values are expressed as means ± sd, n = 3. *P < 0.01 vs. controls; Student's t test. E) N2A cells were transfected with NFκB expression plasmid. Protein levels of MIF in N2A cells were assessed by Western blot on a 12% Tris-tricine SDS-PAGE gel. MIF was detected by anti-MIF antibody; β-actin was used as internal control. F) Quantification of E. Level of MIF protein is expressed as relative ratio to β-actin. Values are expressed as means ± sd, n = 3. *P < 0.01 vs. controls; Student's t test. G) HEK293 cells were transfected with MIF promoter plasmids and subjected to hypoxia treatment or cotransfected with NFκB p65 expression plasmid. Promoter activities were evaluated as in A. Values are expressed as means ± sd, n = 6. *P < 0.01 vs. controls; 2-way ANOVA with Bonferroni posttest. H) HEK293 cells were cotransfected with NFκB p65 expression plasmid with additional hypoxia treatment, and promoter activities were evaluated as in A. Values are expressed as means ± sd, n = 6. *P < 0.01 vs. controls; 2-way ANOVA with Bonferroni posttests. I) HEK293 cells were transfected with NFκB expression plasmid and subjected to hypoxia (2% of oxygen balanced by nitrogen). Total RNA was extracted from cells by Tri reagent, and semiquantitative RT-PCR was used to measure MIF mRNA with MIF gene specific primers. GAPDH mRNA was used as the internal control. J) Quantification of I. Values are expressed as means ± sd, n = 3. *P < 0.001 vs. controls; Student's t test. K) HEK293 cells were transfected with NFκB expression plasmid and subjected to hypoxia (2% of oxygen balanced by nitrogen). Protein levels of MIF were assessed by Western blot on a 12% Tris-tricine SDS-PAGE gel. L) Quantification of K. Values are expressed as means ± sd, n = 3. *P < 0.01 vs. controls; Student's t test.

