
Figure 1. Acetylation of lysyl residues within conserved acetylation motif of Pparγ.
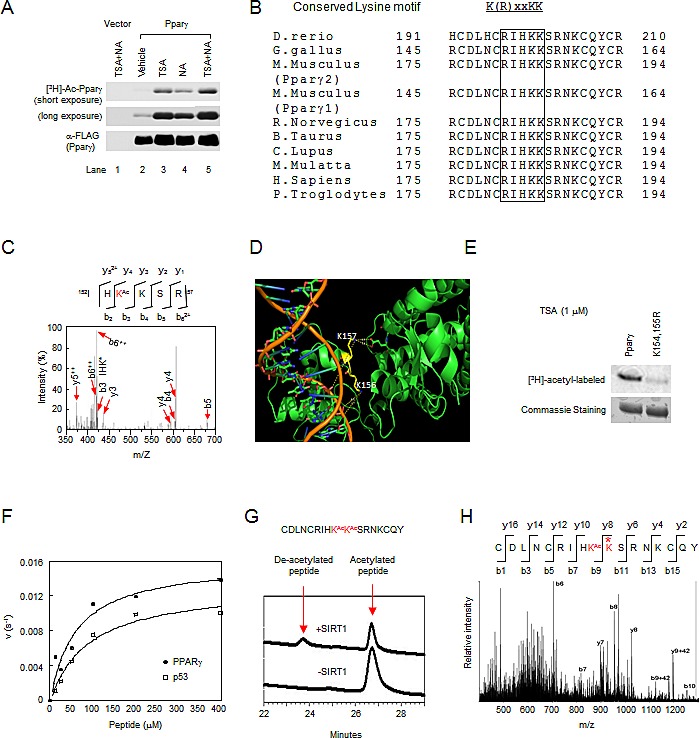
(A) The inhibition of either TSA-sensitive or NAD-dependent deacetylase activity induced Pparγ acetylation assayed by in vivo [3H]-sodium acetate labeling. (B) The conserved acetylation motif in Pparγ is shown for several species. (C) Tandem MS (MS/MS) spectrum of Pparγ showing the acetylation at K154 (Red letter), “Ac” indicates lysine (K) residues that is acetylated. (D) A cylinder model for the crystal structure of hPPARγ1 with DNA double helix (orange color). The lysine 156 and 157 are shown in yellow. (E) Mutant K154/155R significantly reduced Pparγ acetylation. (F) The deacetylation rate of Pparγ or p53 peptide of different concentrations by SIRT1. The lines are best fits to the Michaelis-Menten equation and determine the following values for Km and Vmax: PPARγ (•), Km is 60.1 μM, vmax is 0.016s-1; ASp53 (ƀ), Km is 90.5 μM, vmax is 0.013s-1. (G) HPLC chromatograms of Pparγ peptide deacetylation with SIRT1 enzyme. Untreated diacetylated Pparγ peptide is shown at bottom chromatogram. (H) MS/MS spectrum of the deacetylated Pparγ. Asterisk indicated deacetylated lysine residue.