
Figure 4. Acetylation-defective mutant of Pparγ is associated with decreased lipogenesis.
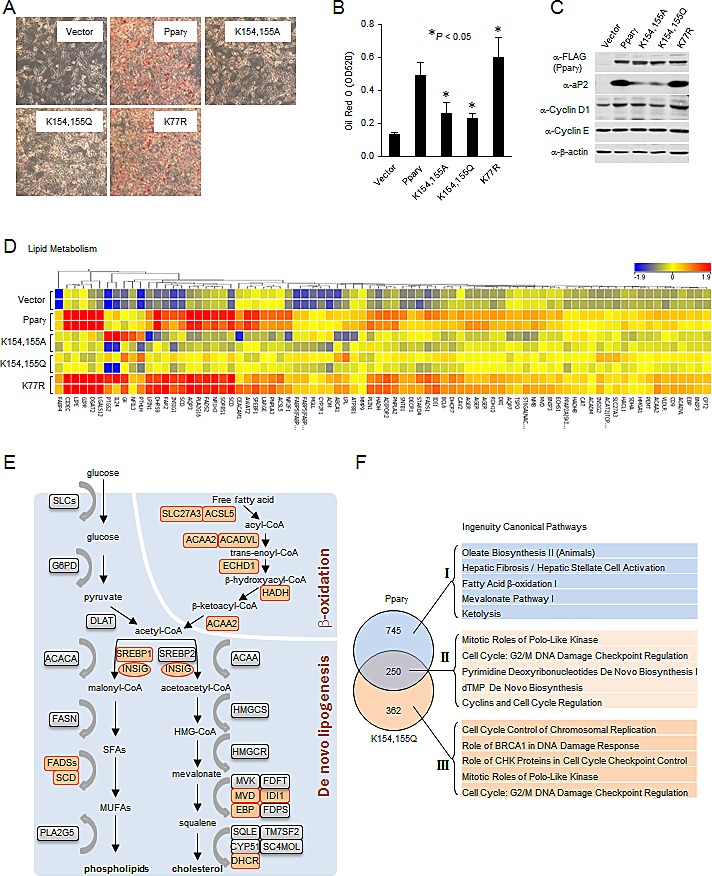
(A) MCF10A-NeuT cells expressing various mutants of Pparγ were cultured until they were confluent, after 2 days, cells were stained with Oil Red O, and photographed. (B) Quantitative analysis of lipids in cells shown in (A) was performed by measuring the OD 520 nm of the Oil Red O stained cells eluted with 4% Igepal CA-40 in isopropanol (v/v). The results are shown as the average of three experiments; the bars indicate mean ± SEM. (C) Total cellular proteins from cells subjected to the same experimental protocol as in (A) were collected, and analyzed by Western blot as indicated. (D) Heat map of genes of lipid metabolism differentially regulated by Pparγ and vector control. (E) Schematic representation of the key enzymes of lipogenic signaling pathway. Genes upregulated by Pparγ are highlighted (orange color). (F) The genes differentially regulated in MCF10A-NeuT cells expressing wild-type Pparγ or Pparγ acetylation mutant were analyzed by the Ingenuity Pathway. The top five Canonical Pathways were listed corresponding to the loss of function with Pparγ acetylation mutant (I), the gain of function (III) and those unchanged by acetylation (II).