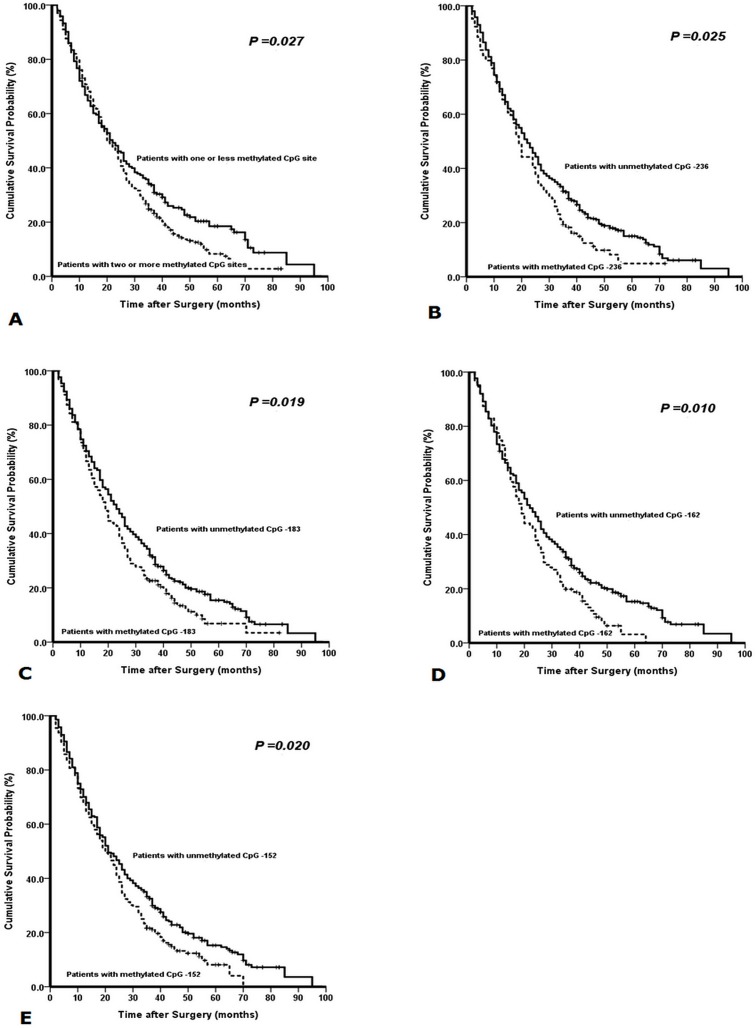
Figure 4.
Kaplan-Meier survival curves comparing months of survival in gastric cancer patients are shown for (A) methylated CpG site count of PAX5 promoter, (B) methylated status of CpG -236, (C) methylated status of CpG -183, (D) methylated status of CpG -162, and (E) methylated status of CpG -152.

