Figure 1. Hypoxia induces expression of stem cell markers in BC cell lines.


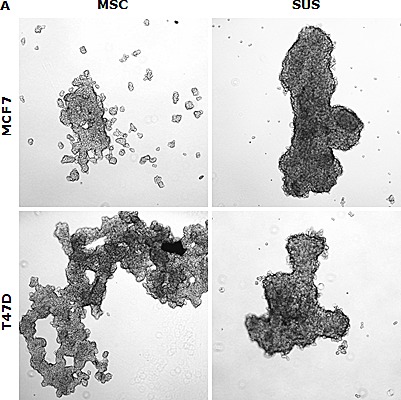
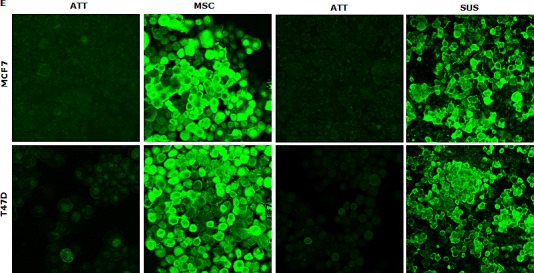
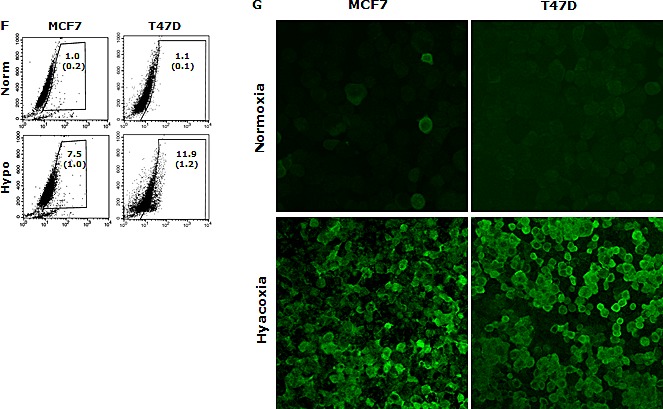
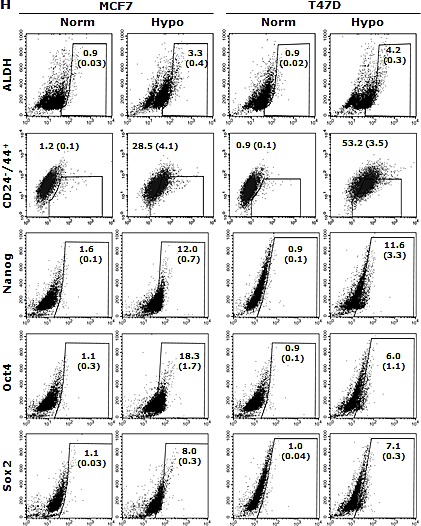
A. The morphology of spheres cultured in serum-free (MSC) and serum-containing (SUS) medium (40× magnification). B. Flow cytometric analysis of ALDH activity and expression of CD24, CD44, Oct4, Sox2 and Nanog proteins in monolayer- and suspension-cultured cells. In comparison with the attached cells, all of these markers are expressed significantly higher in MSC and SUS (p<0.01). C. Specificity of ALDEFUOR in detection of ALDH activity in BC cell lines. DEAB: specific inhibitor of ALDH. D. Flow cytometric detection of hypoxic cells stained with Hypoxyprobe. Significantly higher population of hypoxic cells was detected in MSC and SUS cells (p<0.01). E. Confocal microscopy images of the hypoxic cells detected by Hypoxyprobe in serum-free (MSC) and serum-containing (SUS) medium cultured BC cells (×400 magnification). F and G. Hypoxyprobe stained hypoxic population in hypoxia-cultured BC cells was detected by flow cytometry (F) and immunocytochemistry (G) respectively. H. Flow cytometric comparison of ALDH activity and expression levels of CD24, CD44, Oct4, Sox2 and Nanog proteins in normoxia- and hypoxia-cultured cells. In comparison with the normoxic cells, stem cell markers were detected in significantly higher population of the hypoxic cells (p<0.01). ATT: monolayer culture; MSC: serum-free stem cell culture; SUS: serum-containing medium culture; Norm: normoxia; Hypo: hypoxia. The numbers in the frame represent Mean (SD) from three experiments.
