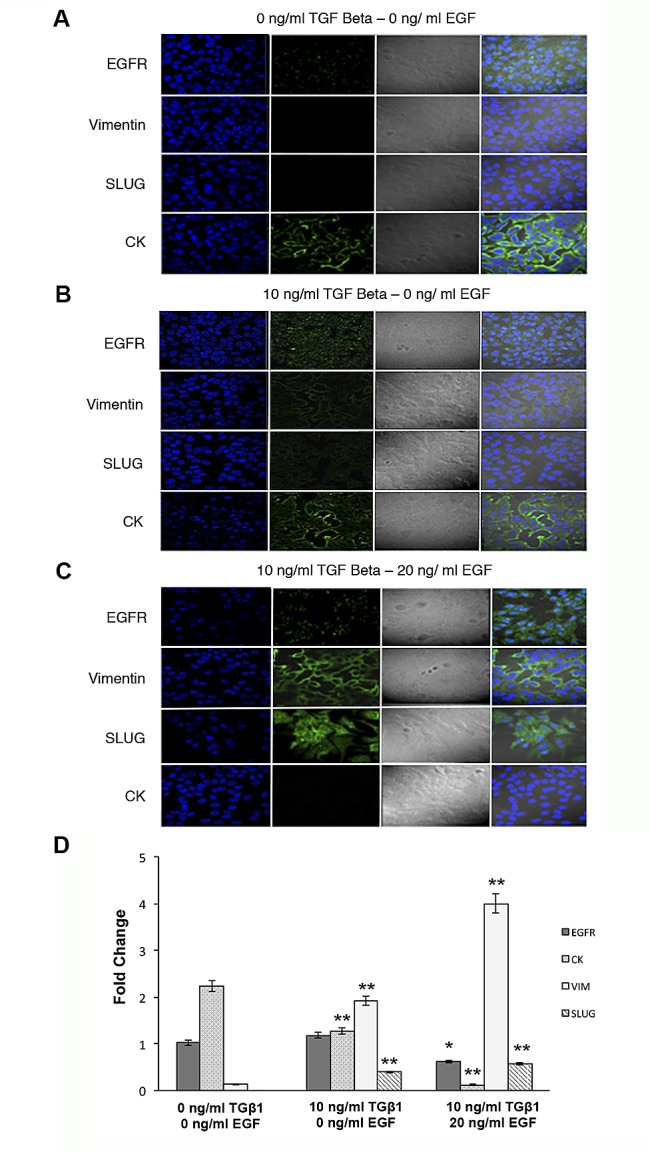
Figure 3. Expression of EGFR, VIM, Slug and CK in MCF-7 cells after TGFβ1 and/or EGF induction.

Confocal microscopy and RT-qPCR examination of MCF-7 cells treated with TGFβ1 (0 and 10 ng/ml), EGF (20 ng/ml), or a combination of TGFβ1 and EGF (10 ng/ml and 20 ng/ml, respectively) for 72 h. Representative immunofluorescence and light microscopic images of EGFR, VIM, Slug and CK staining. Microscope fields shown are representative of at least three different assessments. (A) Non-treated control cells showed marked staining for CK and a low EGFR expression. (B) TGFβ1-treated cells displayed the expression of VIM and Slug and a decrease in CK staining. (C) TGFβ1/EGF combined treatment induced a high expression of EGFR, VIM and Slug and the total disappearance of CK. Nuclei are stained with DAPI (blue). Original magnification 20x. (D) RT-qPCR analysis of mRNA EGFR, CK8, Slug and VIM expression levels. Data represent the mean ± SD from three independent experiments (*p<0.05, ***p<0.01 vs. control non-treated cells).
