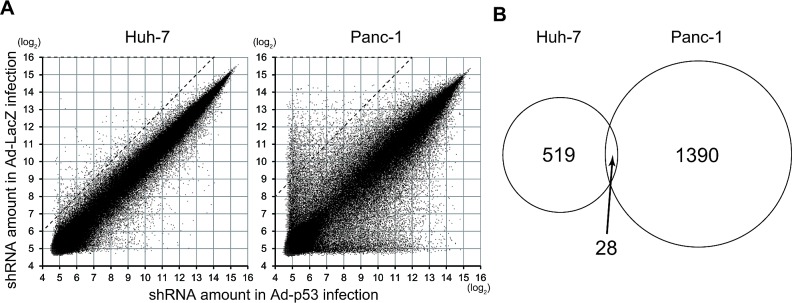
Figure 2. Analysis of the shRNA library screen in p53-transduced cells.

(A) shRNA populations were quantified by cDNA microarray in p53-transduced Huh-7 and Panc-1 cells. The amount of each shRNA in p53-transduced cells was plotted against the amount of the shRNA in LacZ-transduced control cells as log2. In Huh-7 cells, 547 shRNAs decreased more than 4-fold in p53-transduced cells compared with control cells. In Panc-1 cells, 1418 shRNAs decreased more than 16-fold in p53-transduced cells compared with control cells (areas encircled by dashed lines). (B) The overlap of the selected shRNAs in Huh-7 and Panc-1 cells is displayed in a Venn diagram.
