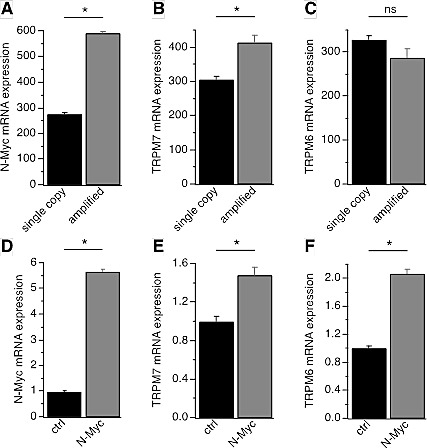
Figure 1. TRPM6 and TRPM7 correlation with MYCN in neuroblastoma.

A-C, N-Myc, TRPM7 and TRPM6 mRNA expression correlation with MYCN amplification in the Kocak-649 cohort. Microarray analysis of N-Myc, TRPM7 and TRPM6 mRNA expression in Kocak-649 (GSE45547), the largest neuroblastoma cohort in the public domain. The graphs present N-Myc (A), TRPM7 (B) and TRPM6 (C) expression in tumors without (n=550) and with (n=93) MYCN amplification. Y-axes represent sample ranks in a non-parametric Kruskal-Wallis t test; actual mean ± s.e.m. expression values were: 17,839 ± 1,137 (MYCN), 104.9 ± 3.7 (TRPM6), 807.0 ± 321.1 (TRPM7). Both N-Myc and TRPM7 expression are significantly higher in tumors with MYCN amplification (p=1.5 • 10−51 and p=2.3 • 10−7 respectively; Kruskal-Wallis t test). D-F, qRT-PCR analysis of N-Myc (D), TRPM7 (E) and TRPM6 (F) expression levels in the SHEP-21N cell line where MYCN transgene is controlled by tetracycline, i.e., N-Myc expression is repressed in the presence of tetracycline (control), but removal of tetracycline induces N-Myc expression (N-Myc). The graphs show normalized N-Myc, TRPM7 and TRPM6 expression in SHEP-21N cells with (N-Myc, n = 9) or without (control, n = 9) N-Myc expression. *, p<0.01.
