
Fig.1. Downregulation of CLDN3 in HCC.
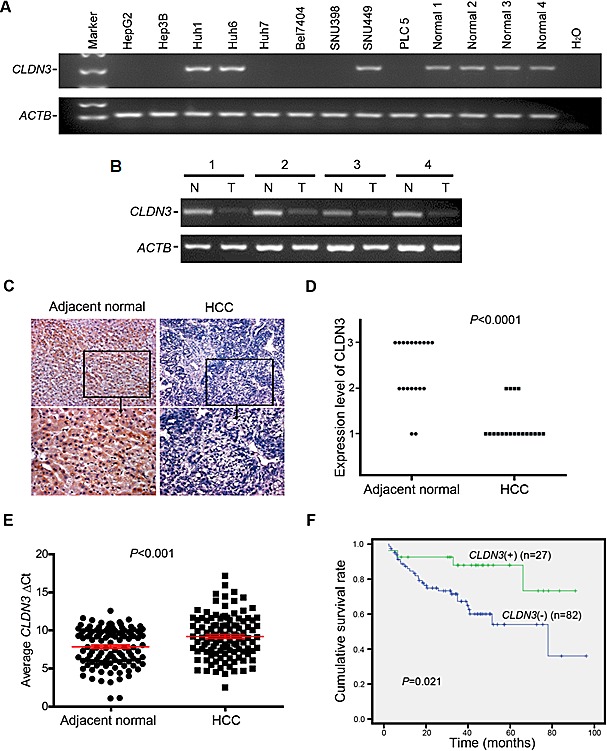
(A) CLDN3 expression was frequently down-regulated in HCC cell lines (A) and primary HCCs (cohort 1) (B) detected by RT-PCR. For primary HCCs, expression of CLDN3 in tumor tissues (T) was compared with their paired nontumorous tissues (N). ACTB was used as a loading control. (C) Representative images of CLDN3 protein expression in a pair of HCC (right) and its adjacent normal tissue (left) determined by immunohistochemistry (IHC) with anti-CLDN3 antibody (brown). The slide was counterstained with hematoxylin. Original magnification, x200 (upper); x400 (lower). (D) CLDN3 protein expression level was indicated by IHC score according to the percentage of CLDN3 positive cells in primary HCC tumor tissues and their adjacent normal tissues (1,<20%; 2, 20-50%; 3,>50%). (E) CLDN3 expression was frequently down-regulated in primary HCCs (cohort 2) detected by qPCR. Dot plots represent the ΔCt values of CLDN3 (higher ΔCT values correspond to lower expression; Mean ± SEM; Mann-Whitney U test). (F) Kaplan-Meier curves for overall survival rate of patients with HCC according to the expression level of CLDN3. Green, patients with normal CLDN3 expression (n=27, mean survival time=78 months); Blue, patients with lower expression of CLDN3 (n=82, mean survival time=60 months, P=0.021)