
Fig.3. Morphological change and foci inhibition role of CLDN3 in HCC cells.
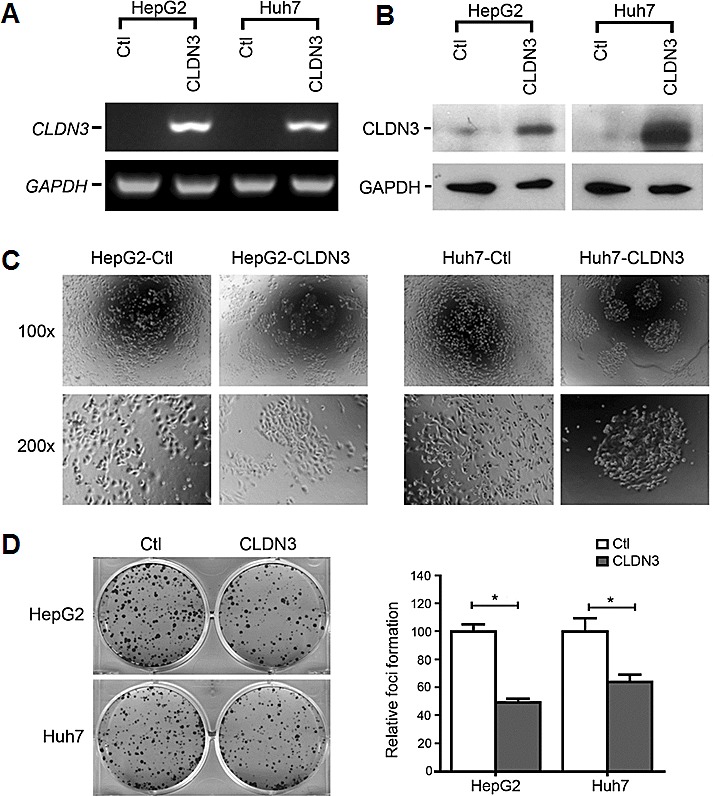
Ectopic expression of CLDN3 in HCC cell lines (HepG2 and Huh7) was confirmed by RT-PCR (A) and western blot (B). (C) Representatives of cell morphology of CLDN3-expressing cells (HepG2-CLDN3/Huh7-CLDN3) and control cells (upper, original magnification ×100; lower, ×200). (D) Representative of foci formation in monolayer culture. Quantitative analyses of foci numbers were shown in the right panel. Values were the mean ± SD of at least three independent experiments. *P<0.05; independent Student's t-test.