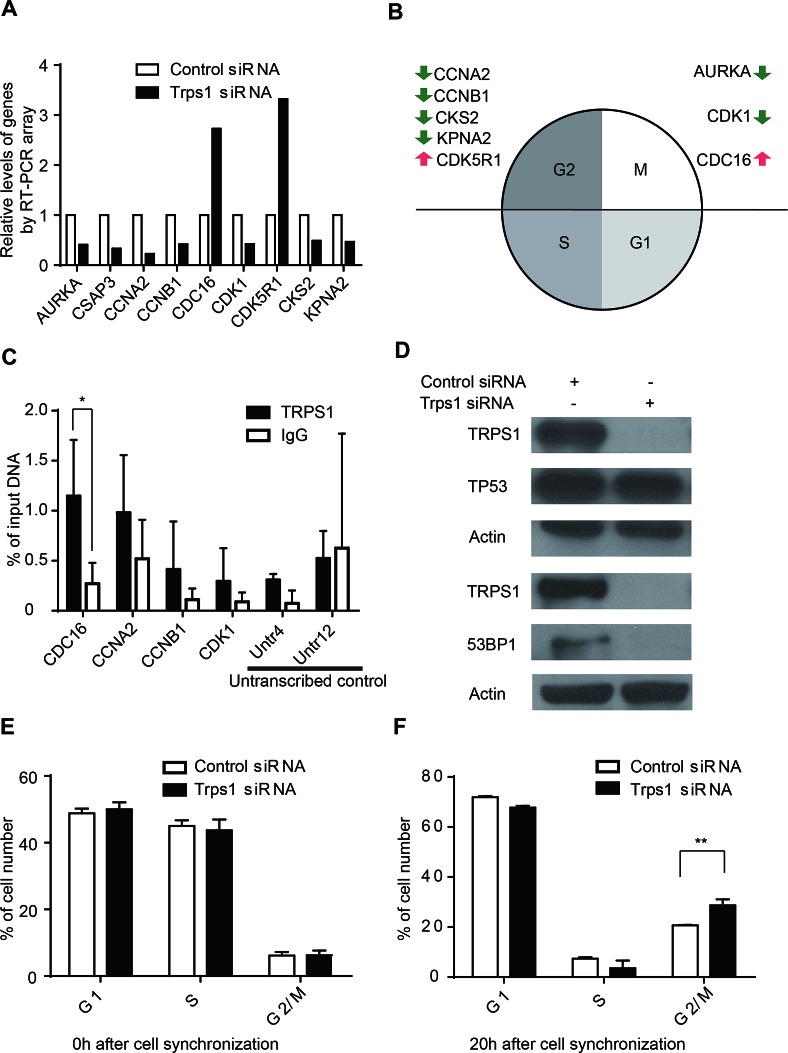
Figure 2. TRPS1 regulates cell cycle progression by controlling the expression of cycle cell genes.
(A) Significantly changed cell cycle-related genes (>2-fold or <0.5-fold) after TRPS1 silencing. (B) Functional annotation of cell cycle-related genes with respect to the cell cycle. Green and red arrows represent down- and up-regulated gene expression after TRPS1 knockdown. (C) DNA binding activity of TRPS1 on cell cycle gene promoters determined by ChIP-qPCR analysis. *p <0.05. (D) Western blotting showed that 53BP1 was down-regulated whereas TP53 was unaffected after TRPS1 knockdown. (E) Cells were successfully synchronized to G1/S stage using a double thymidine block (0 h). (F) There was a significant accumulation of Trps1-knockdown cells in the G2/M phase at 20 h after release from synchronization. **p <0.005.

