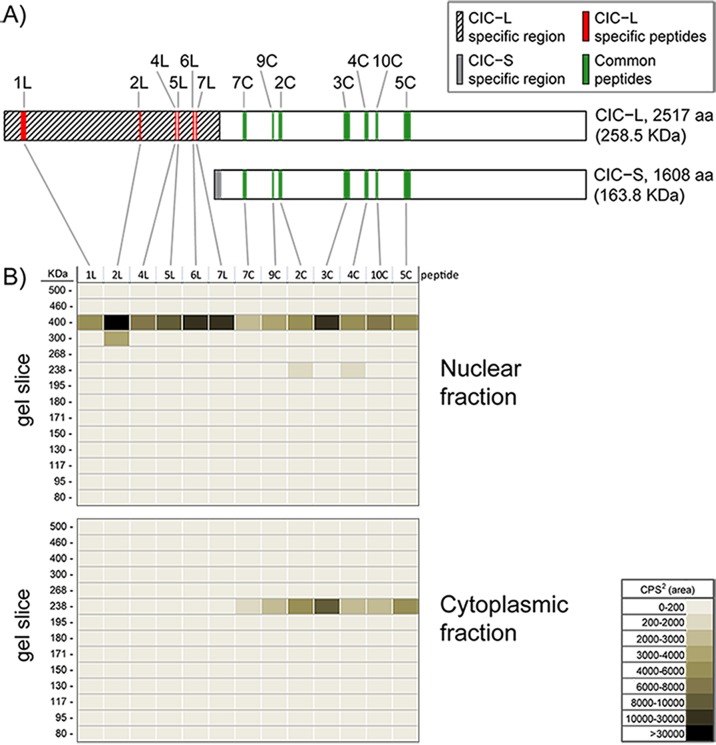
Figure 2. Mass spectrometry analysis confirms the localization of CIC-L to nuclei and CIC-S to the cytoplasm.
A. Shown are the locations of the CIC peptides used to monitor the subcellular location of CIC by Multiple Reaction Monitoring (MRM) MS assays. A protein alignment cartoon shows the positions of the measured peptides specific for CIC-L (1L-7L; red) and the measured peptides common for both isoforms (2C-10C; green), see Supplementary Figure 2 for the sequence of the peptides. CIC-L and CIC-S specific regions are indicated in hatched and grey, respectively. Unfilled regions are common to both isoforms. B. Nuclear and cytoplasmic fractions were isolated from HEK cells and CIC isoforms were immunoprecipitated using an anti-CIC antibody. Immunoprecipitates were run on a protein gel and proteins were isolated from 14 different slices of the gel in the 80-500 KDa region. Isolated proteins were used to detect peptides specific to CIC isoforms by MRM-MS. Peptides from each slice were measured. The peptide ion densities for the peptides are shown as a heat map for nuclear and cytoplasmic fractions (summed areas of each peptide transition peak, as counts per second2 (cps2)). The data are representative of two independent trials.

