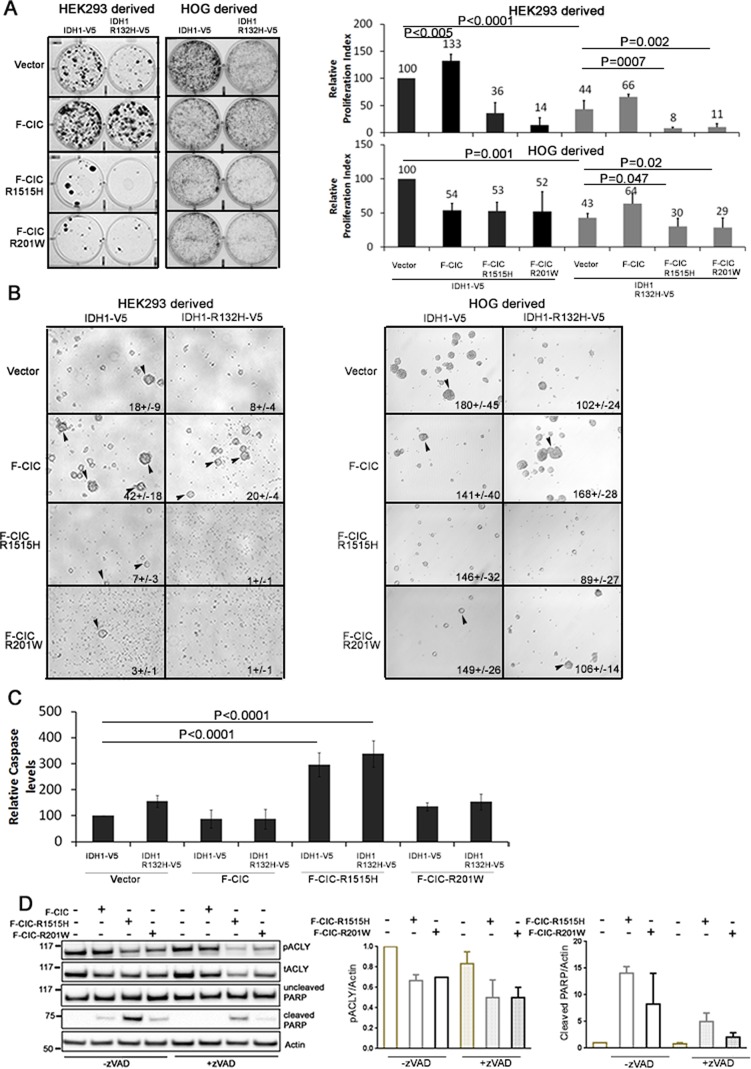
Figure 8. CIC and IDH1 coordinately regulate cell clonogenicity and mutations in CIC regulate cell death by reducing pACLY levels in vitro.
A. Clonogenic assays of HOG and HEK-derived stable cell lines were performed in serum free media with low FBS and growth factors. Proliferating cell colonies were visualized using crystal violet stain one week (HOG) or two weeks (HEK) after culturing. Proliferation indices were calculated relative to cells expressing IDH1-V5 and vector only (endogenous CIC). Error bars represent the SD from 3 independent experiments. Multiple comparisons using mean values were performed using one-way ANOVA. B. Stable cell lines were cultured under oligodendroglioma cell growing conditions without FBS to form spheres. Spheres were viewed under an inverted light microscope. Images were taken 1 week after plating. Compared to cells expressing wild type IDH1 only or wild type IDH1 and CIC, sphere formation was reduced in cells expressing mutant CIC and mutant IDH1. Sphere counts (+/− standard deviation) represent results obtained from 3 independent experiments. C. Stable cell lines were grown in serum free media with 0.5% FBS and growth factors for 72hrs and caspase 3 and 7 expression was determined using the Caspase-Glo® 3/7 assay. Caspase levels were calculated relative to cells expressing IDH1-V5 and vector only (endogenous CIC). Cells expressing F-CIC-1515H showed the highest levels of caspase activity (p<0.0001). Error bars represent the SD from 3 independent experiments. D. Stable lines expressing mutant IDH1-R132H-V5 combined with wild type F-CIC or mutant F-CIC-R1515H or F-CIC-R201W were cultured for 48hrs with or without 10μM zVAD (a pan caspase inhibitor) to determine whether reduction in pACLY led to cell death. Levels of total ACLY, pACLY and cleaved PARP were detected using western blots. zVAD treatment significantly reduced cleaved PARP in cells expressing mutant CIC. Western blots are representative of 3 biological replicates and the bar graphs shown are densitometry quantitations from 3 biological replicates.

