Figure 2.

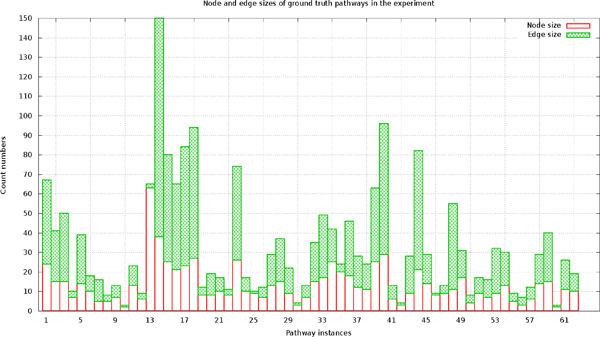
Statistics for the targeted yeast pathways used in experiments. X-axis denotes the indices of the pathways ranging from 1 to 52. Y-axis denotes the number of nodes or edges in each pathway.

Statistics for the targeted yeast pathways used in experiments. X-axis denotes the indices of the pathways ranging from 1 to 52. Y-axis denotes the number of nodes or edges in each pathway.