
Figure 1. General view and calculations of optical power limiter.
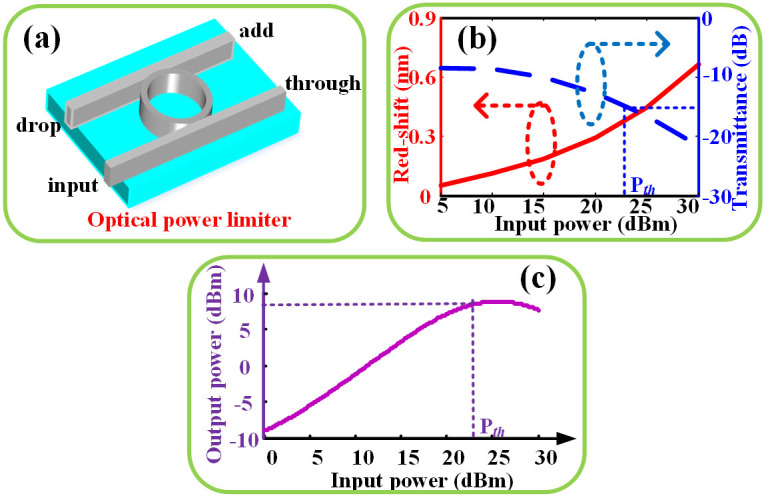
(a) General view of optical power limiter, (b) red curve: calculated red-shift as a function of input power, blue curve: transmittance at drop port as function of input power, (c) calculated output power as a function of input power.