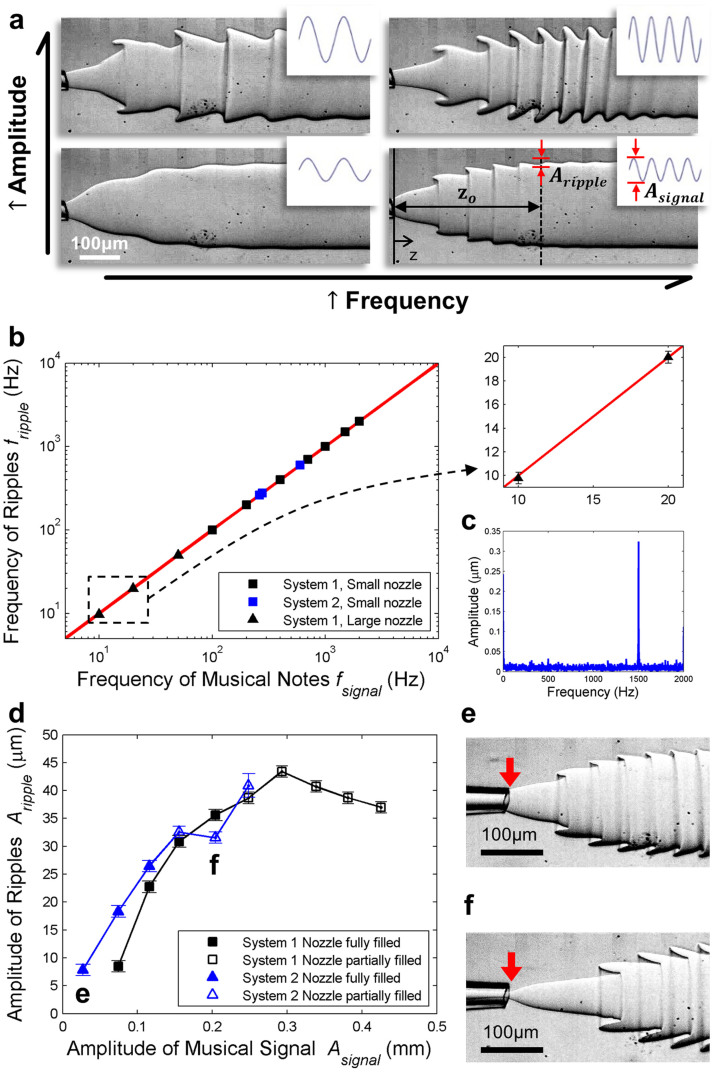
Figure 2. Visualization of the deformation of the passive interfaces in response to the applied vibration.
(a) Optical microscope images of the aqueous jet as the frequency and the amplitude of the musical signal increase from fsignal = 100 Hz to 200 Hz and from Asignal = 0.07 mm to 0.34 mm respectively. Corresponding input sound wave is displayed on the top right of each microscope image. Definition of Aripple and Asignal are illustrated in the bottom right images. The amplitude of ripple is defined as Aripple (z = z0), where z = 0 is at the tip of nozzle and z = z0 is at the minimum distance downstream where the jet no longer expands. The amplitude of musical signal refers to the vibration amplitude of the loudspeaker membrane. (b) Left: A log-log plot of frequency of ripples fripple as a function of the frequency of musical signal applied fsignal. The range of frequency tested is between 10 Hz and 2000 Hz. The straight line has a slope of one. Right: The magnified view showing two successive data points (fsignal, fripple): (10.00, 9.77 ± 0.5) and (20.00, 20.02 ± 0.5) in the range of infrasound. Each data point is obtained by averaging the results from three to six measurements. (c) A frequency spectrum obtained by analyzing a series of high-speed microscope images of an aqueous jet under the perturbation of a musical note of 1500 Hz, taken at 4000 fps. (d) Plot of amplitude of ripple Aripple against amplitude of musical signal Asignal. System 1 is composed of two immiscible aqueous solutions of sodium citrate and PEG while System 2 is composed of two immiscible aqueous solutions of tripotassium phosphate and PEG. In both systems, the PEG-rich phase constitutes the outer phase. System 1 has a lower viscosity ratio (μout/μin) than System 2. Each data point is obtained by averaging the results from ten measurements. Microscope images of the (e) fully-filled-nozzle regime and (f) partially-filled-nozzle regime.

