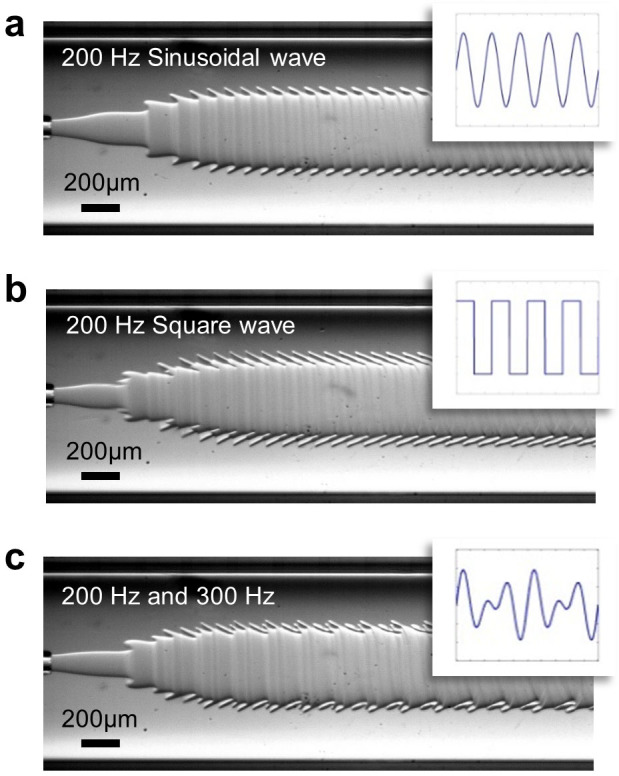
Figure 3. Visualization of sound signals of different waveforms.

Varying the waveform of the musical signal from (a) a sinusoidal signal of 200 Hz to (b) a square signal of 200 Hz to (c) a composite signal (a superposition of 200 Hz and 300 Hz sinusoidal signals), while the amplitude is fixed at Asignal = 1 mm. Corresponding input sound wave is displayed on the top right of each microscope image.
