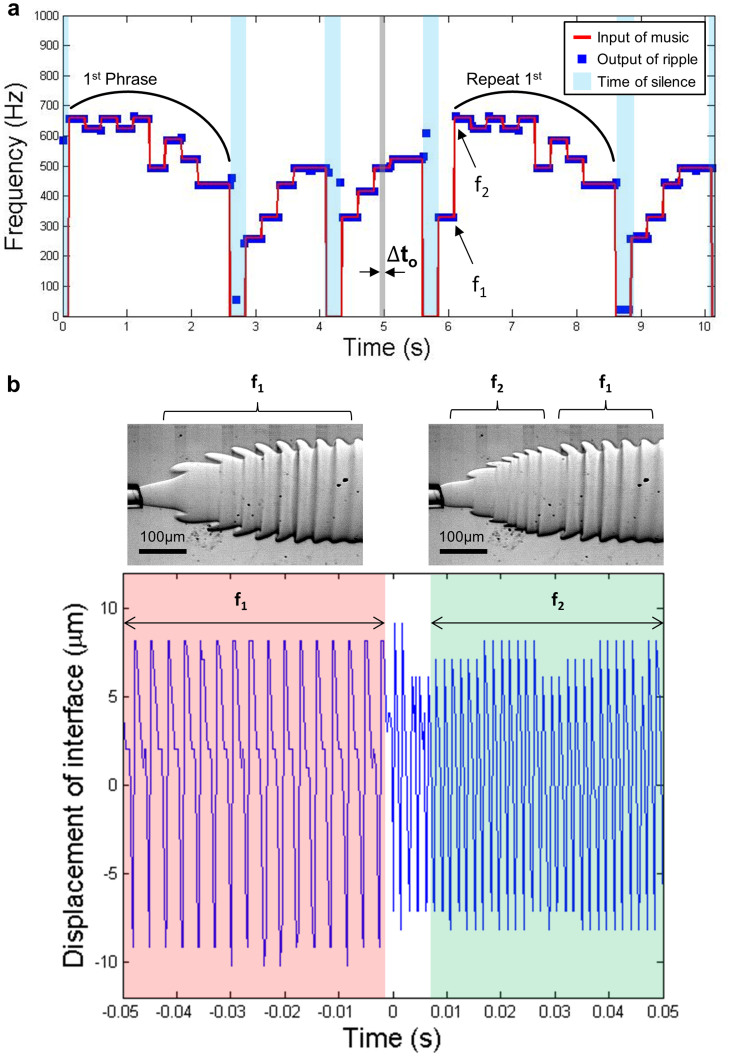
Figure 4. Reconstruction of frequency for Für Elise.
(a) Frequency-time plot of the musical notes played and the musical notes reconstructed by image analysis. The time interval (Δto = 33 ms) shaded in gray is the time interval between successive data points. The blue squares and the red lines denote the frequencies of ripples and of the musical notes played respectively. The time shaded in blue indicates the time of silence during which no music is played. The frequency range of this graph is confined to be between 0 Hz and 1000 Hz. The first phrase which begins at t = 0.1 s is repeated at t = 6.1 s. The procedure for recording music with our “interfacial ear” is demonstrated in Supplementary Movie S3. (b) The displacement-time plot of the interface with an abrupt change in the applied musical signal at t = 0 s (Bottom). Microscope images showing the shape of ripples before and after an abrupt change in the applied music (Top).

