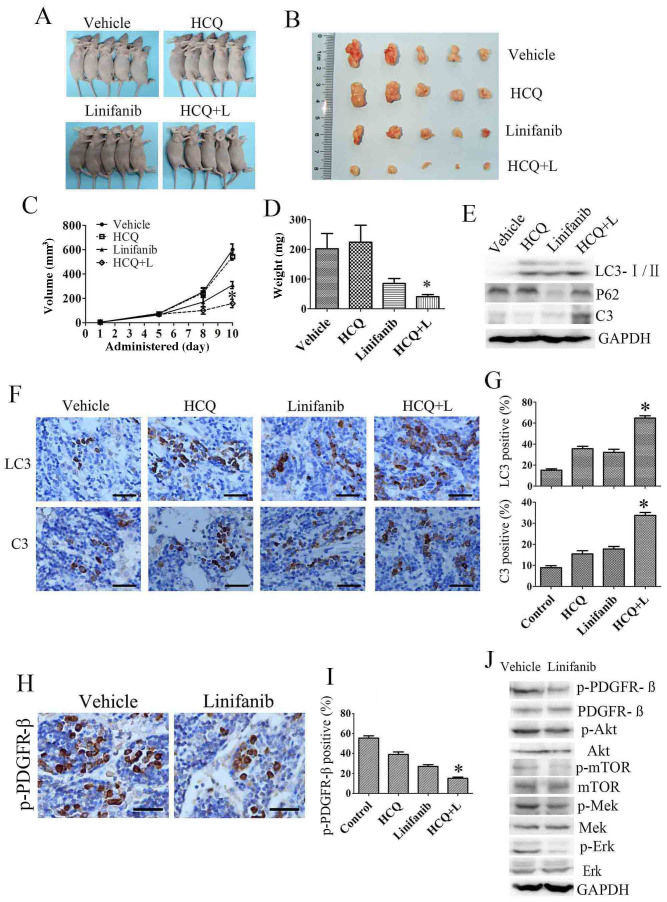
Figure 6. Autophagy inhibition enhances the anti-tumor effect of linifanib in Bel-7404 xenograft models.
(A&B). Tumors from nude mice in each treatment group. (C&D). Tumor volume and weight in each group. (E). Tumor lysate was subjected to immunoblotting for LC3, p62 and cleaved caspase-3 (C3). Each lane represents lysate from five mice. (F). Immunohistochemical staining of LC3 and cleaved caspase-3 using paraffin embedded sections. (G). Quantification of LC3, cleaved caspase-3 staining by Image Pro Plus 5.0. (H). Immunohistochemical staining of p-PDGFR-ß in vehicle or linifanib treated tumor. (I). Quantification of the p-PDGFR-ß by Image Pro Plus 5.0. (J). Tumor lysate was subjected to immunoblotting for PDGFR-ß and down-stream Akt/mTOR and Mek/Erk signaling pathways. Each lane represents lysate from five mice. Data were expressed as the mean ± SD. C, D, G & I, Linifanib + HCQ vs linifanib, * P<0.05.

