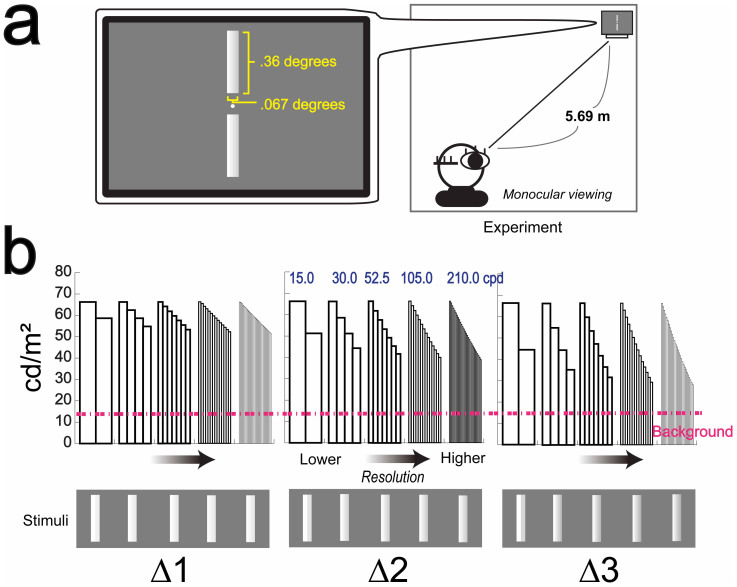
Figure 2. Experiment and Stimuli set.
(a), Two same-size but different-resolution bars were vertically presented for 1.0 second. The distance between two stimuli was .12 degree. To avoid that the participants easily detect the stimulus resolution difference, they were shown very small, .36 × .067 degrees. After the stimuli disappeared, the participants reported which stimulus they perceived more depth, upper or bottom. The combination of these stimuli resolution was varied from trial to trial. (b), Five kinds of resolution were used, 15.0, 30.0, 52.5, 105.0, 210.0 cpd. Also, there were three different kinds of stimuli set, Δ1, Δ2, and Δ3 (see Methods). Y axes represent the actual luminance value of each stimulus. The pink dashed line indicates the luminance value of the gray background (14.4 cd/m2). The presented stimuli are drawn by the same algorithm used in the real experiments.

