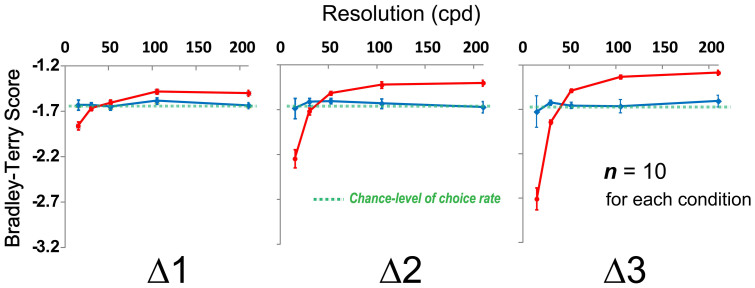
Figure 3. Results of Depth Task and Resolution Task.
Mean Bradley-Terry score (BTS)12 for each stimulus in the depth task (red lines) as a function of the resolution (cpd) (n = 10). Mean BTS for each stimulus in the resolution task (blue lines) as a function of the resolution (n = 10). Green dashed lines represent the chance-level choice rate (50% choice rate in two alternative forced choice). Vertical error bars, ±1 SEM. Higher resolution significantly facilitated the participants' depth perception in all data set (e.g. mean BTS at the highest resolution (210.0 cpd) was significantly higher than at the lowest resolution (15.0 cpd) in Δ1, n = 10, p < .001, t test with Bonferroni correction). There were no significant difference between the performance results of the resolution task (blue lines) and the chance-level of choice rate (green dashed lines), that is, they were not able to detect the resolution difference.

