
Figure 1.
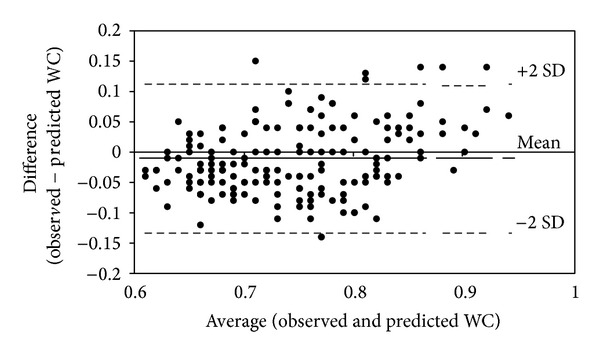
Bland Altman plot of WC differences between observed and predicted values. The solid line is at the bias and the dashed lines are at ±95% limits of agreement.
Official websites use .gov
A
.gov website belongs to an official
government organization in the United States.
Secure .gov websites use HTTPS
A lock (
) or https:// means you've safely
connected to the .gov website. Share sensitive
information only on official, secure websites.
Bland Altman plot of WC differences between observed and predicted values. The solid line is at the bias and the dashed lines are at ±95% limits of agreement.