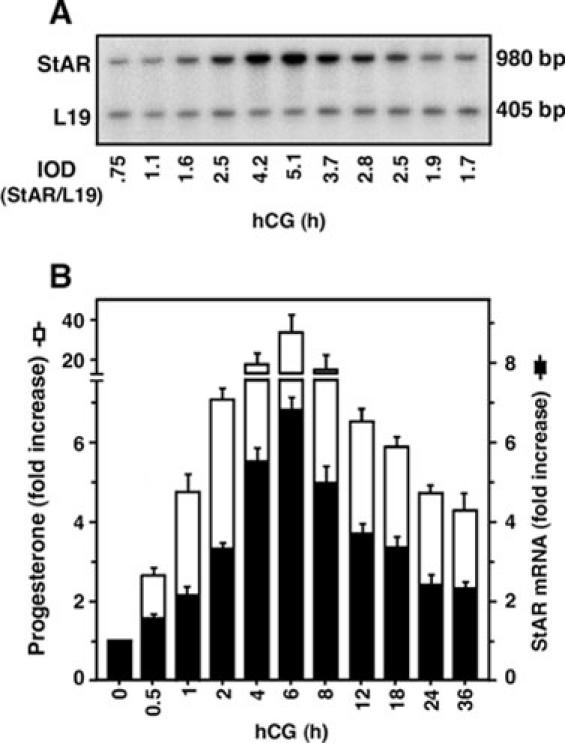
Fig. 1. Temporal response pattern of hCG stimulated StAR mRNA expression and progesterone production in mLTC-1 cells.

A representative autoradiogram illustrates StAR mRNA expression in response to hCG at different times (0-36 h), as determined by quantitative RT-PCR (panel A). Panel B illustrates the integrated optical density (IOD) of StAR mRNA expression at each time point after normalizing with the corresponding L19 bands (black bar). The production of progesterone in the media of the same samples was determined (white bar). Data represent the mean ± S.E. of three independent experiments.
