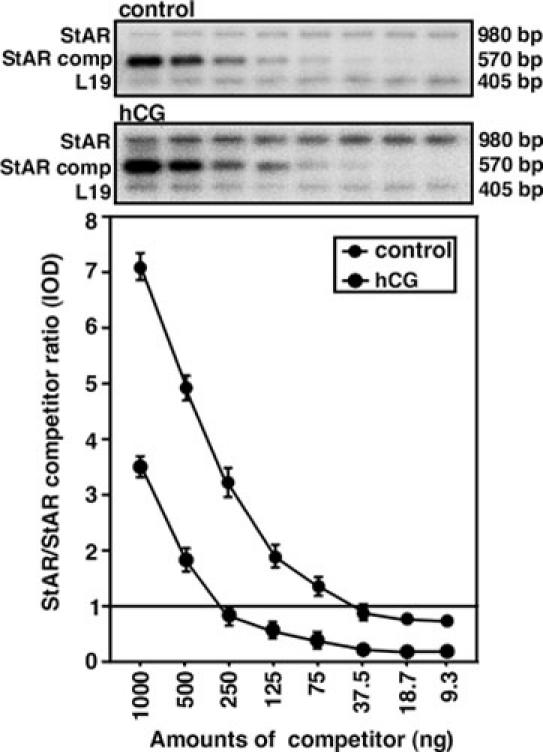
Fig. 2. Schematic representation of the competitive RT-PCR to verify the quantitative accuracy of hCG induced StAR mRNA expression in mLTC-1 cells.

Decreasing amounts of StAR competitor (1000-9.3 ng) were incubated with a fixed amount of total RNA from control and hCG-treated samples, as described in Materials and Methods. The IOD ratio of StAR/StAR competitor from both control and hCG-stimulated groups was corrected for using the corresponding intensity of the L19 bands. The situation where the amplicon ratio is 1 (horizontal line) indicates hCG induced StAR mRNA expression when compared with two experimental groups. Data represent the mean ± S.E. of two independent experiments. StAR comp, StAR competitor.
