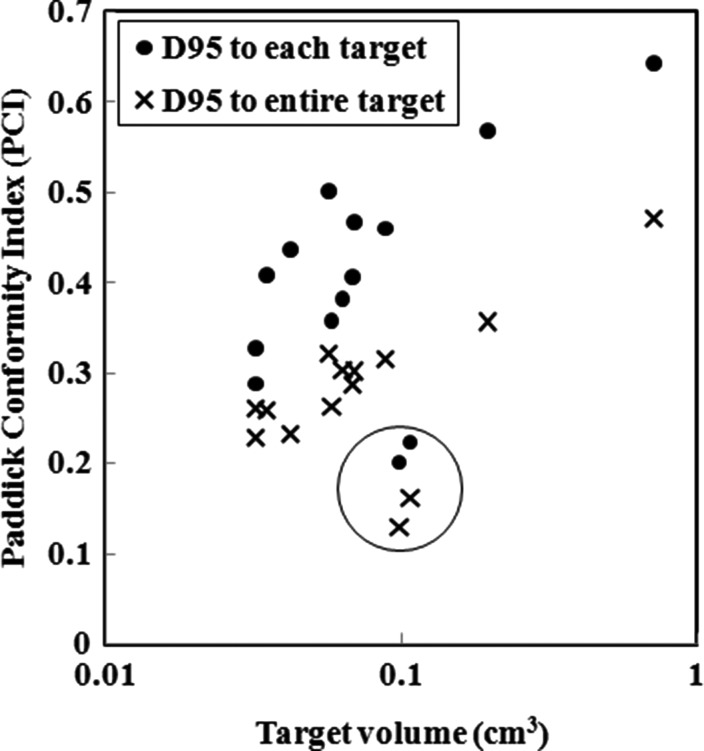
Fig. 6.
Plots of Paddick's conformity index (PCI) for the 14-mets plan as a function of the target volume, where D95 was prescribed for each of the PTVs (marked with filled circles) and to the entire PTVs (marked with X's). It was found that the PCIs for two targets were significantly lower than for the others (marked with open circle), possibly resulting from an exceptionally short distance between the two targets (1 cm).

