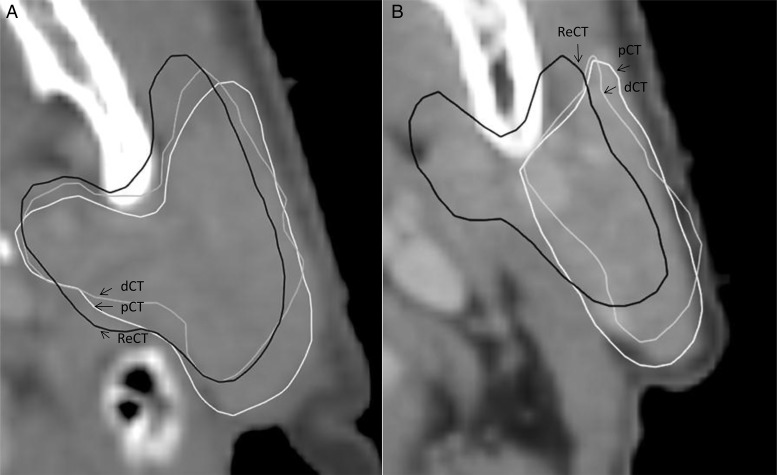
Fig. 2.
Visualization on the pCT of the patient with the lowest value of DSC for the parotid gland in two different CT slices. In some slices (A) the structures are similar, whereas large differences are observed between the dCT and the ReCT structures in other slices (B). The dCT structure resembles the pCT structure, and the large difference between the parotid on the pCT/dCT and the ReCT can, in part, be explained by intraobserver variations in the delineation.

