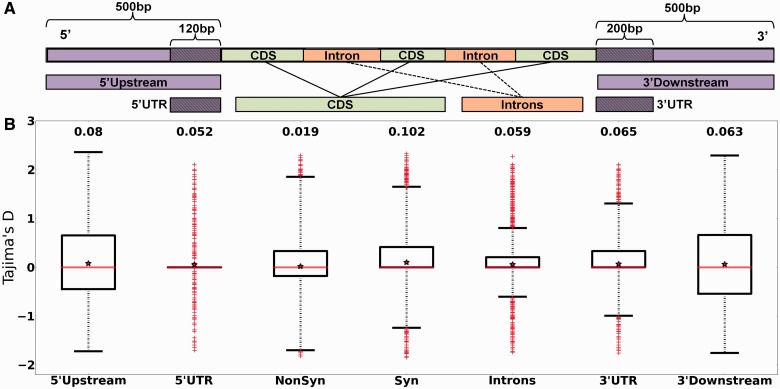
Fig. 1.—
Distribution of Tajima’s D values for each class of sequences. (A) Typical eukaryotic protein-coding gene and sequence classes analyzed in the present study. (B) Boxplots showing the distribution of Tajima’s D values in each class of sequences. Values inside each box correspond to the middle 50% of the data (between the 25th [Q1] and 75th [Q3] percentiles) and the red line within the box represents the median. The ends of the vertical dotted lines (whiskers) at the top and bottom of each box indicate the maximum and minimum limits to consider outliers according to the inter quartile range (IQR = Q3-Q1). Whiskers lengths were calculated as Q3+3*IQR (upper) and Q1−3*IQR (lower). Values outside the lines (red crosses) are extreme outliers. Red stars and values at the top of the boxplots indicate mean Tajima’s D value for each class of sequence.

