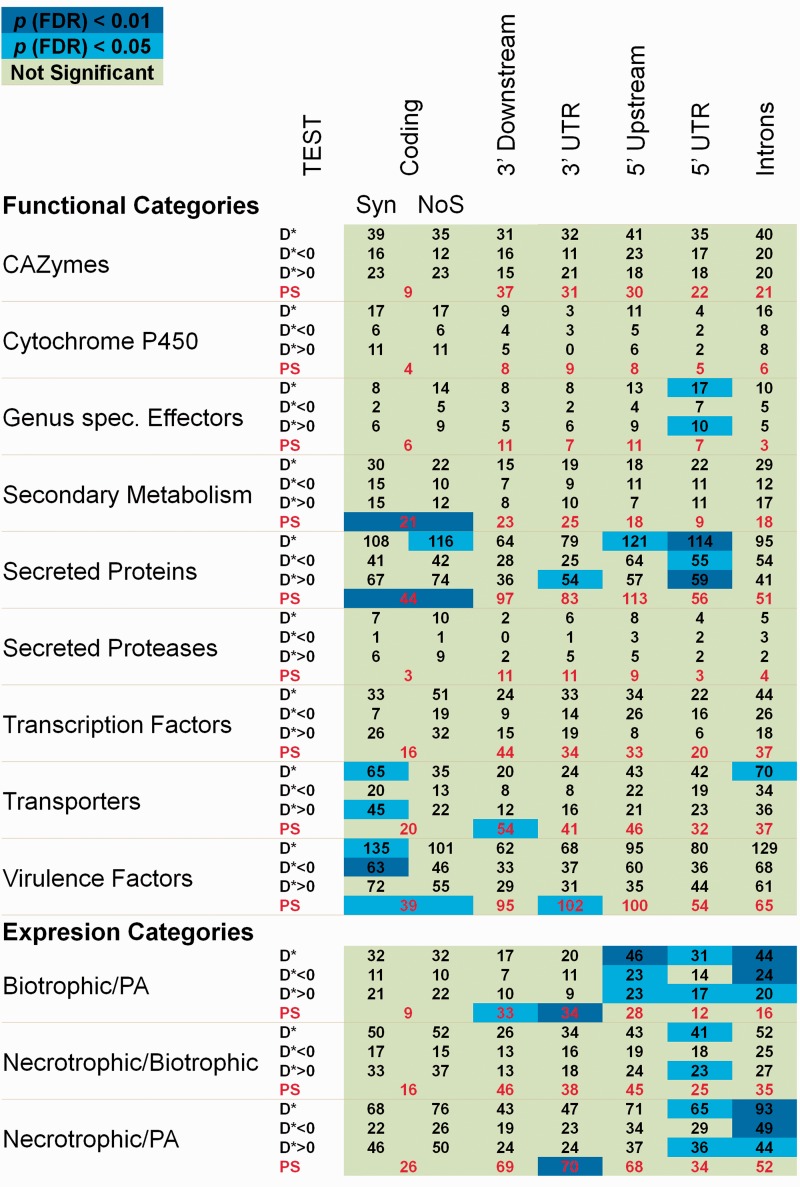
Fig. 2.—
Enrichment of putative nonneutrally evolving sequences in different functional gene categories related with pathogenicity. Table values represent the number of sequences for each class and gene category. Tests: D* (D < 5th percentile or D > 95th percentile), D* < 0 (D < 5th percentile), D* > 0 (D > 95th percentile), and PS (sequences under PS according to LRT tests). Background colors indicate significance of the Fisher’s exact test for enrichment after correction for multiple comparisons by the FDR. See supplementary table S2, Supplementary Material online for more details.

