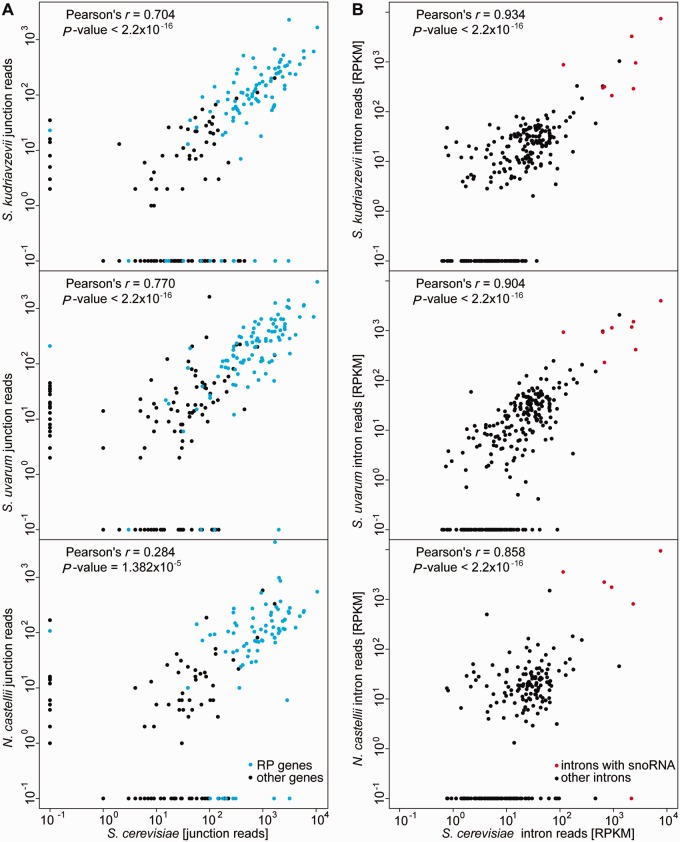
Fig. 2.—
Conservation of intron splicing and expression in RNAseq data. Number of reads spanning confirmed junctions (A) and intron expression estimated by the number of reads per kb per million mapped (B) Saccharomyces kudriavzevii, S. uvarum, and N. castellii RNAseq is compared with corresponding data from S. cerevisiae. RP genes are indicated in blue and snoRNA-containing introns in red. Pearson’s product-moment correlation and P value are shown above each graph.

