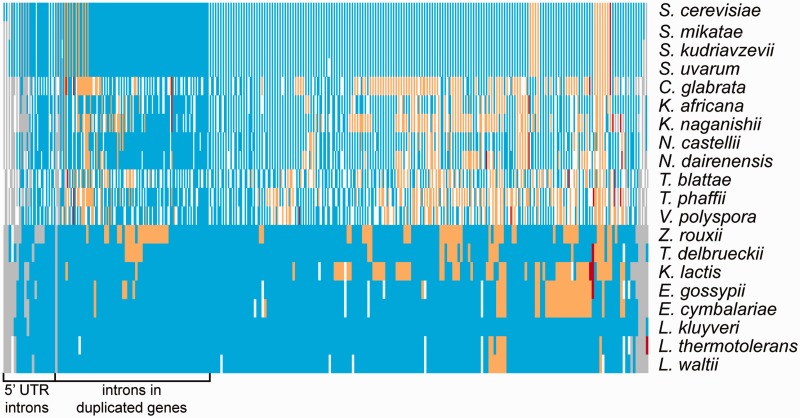
Fig. 4.—
Heatmap showing intron evolution within YGOB species. Each row represents one of the species listed on the right. Each column corresponds to an ancestral intron. For post-WGD species columns are divided in two to represent the presence of the duplicate copies. Blue indicates intron presence, orange indicates loss by replacement of the gene with cDNA, red shows intron loss accompanied by additional codons inserted or deleted, and gray shows unknown state of intron.

