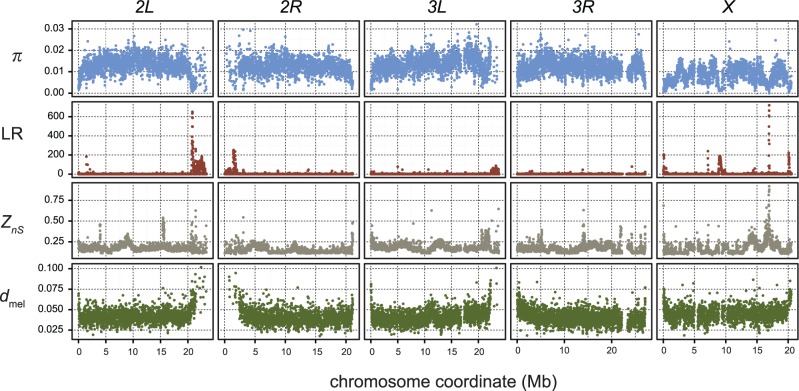
Fig. 1.—
Scans of population genetics statistics across the five major chromosomal arms of the D. mauritiana genome. The four statistics were calculated in nonoverlapping 10-kb windows. Each column of plots represents scans from a single chromosome arm. The top row of plots (blue points) shows scans of nucleotide diversity (π). The second row of plots (red points) shows the distribution of a likelihood ratio test statistic that measures the deviation of the local allele frequency spectrum (LR). The third row of plots (grey points) shows the measure of linkage disequilibrium (ZnS) across all arms. Finally, the bottom row of plots (green points) shows the scan of average sequence divergence between the ten D. mauritiana samples and a single D. melanogaster genome sequence.

