
Figure 3.
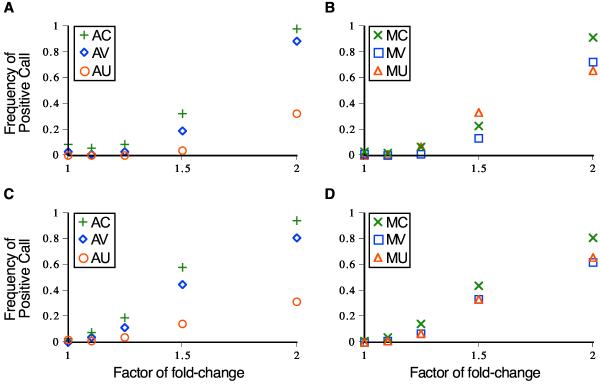
Detection of gene expression differences from ratio data that are gamma or truncated-Cauchy distributed. Frequencies of affirmative significance calls with six analytical models are plotted against the factor of gene expression difference. Symbols represent the analysis model used: AC(+), AV(◇), AU(O), MC(×), MV(□), and MU(△). Diagrams correspond to data simulated from A) and B) a gamma distribution of ratios, and C) and D) a truncated Cauchy distribution of ratios.