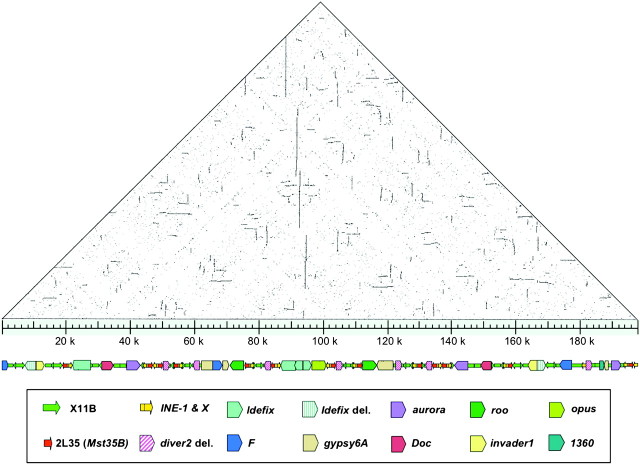
FIG. 1.
Schematic representation of the BACR07N15 sequence. The sequence organization of the large palindrome is represented by the horizontal diagram at the bottom. Sequence similarity within BACR07N15 is depicted above as a triangular dot plot (made with the program “dotter”) in which the BACR07N15 sequence is compared with itself. Direct repeats appear as horizontal lines and inverted repeats as vertical lines.

