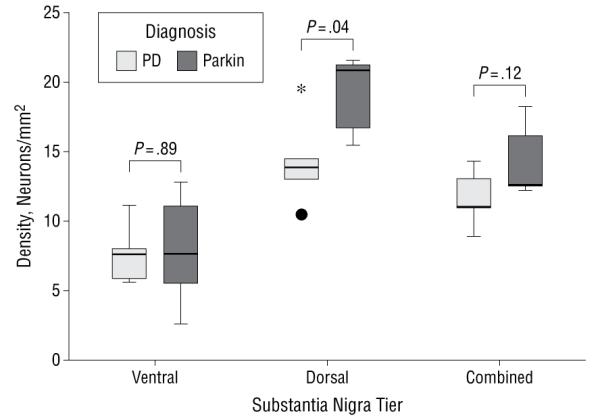
Figure 3. Clustered box plot illustrating neuronal density in ventral, dorsal, and combined (total) nigral tiers in the parkin and Parkinson disease (PD) cases.

The asterisk indicates an extreme score (ie, the value is more than 3 box lengths from the upper quartile) and the black dot indicates an outlier (ie, the value is more than 1.5 box lengths from the lower quartile).
