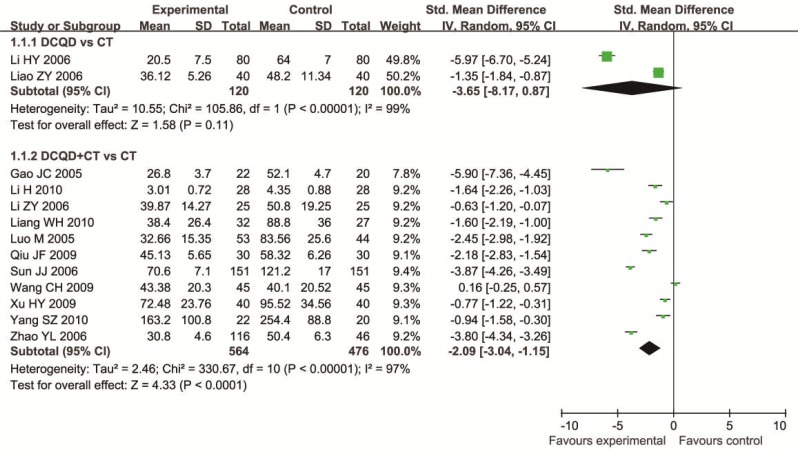
Figure 3.
Forest plot of the time to first flatus
SMD, standardised mean difference; 95% CI, 95% confidence interval
Note that SMD < 0 means numerically time to first flatus in experiment group is shorter than control group and SMD > 0 numerically time to first flatus in experimental group is longer than control group. 95% CI doesn't include the number 0 means statistical difference between the 2 groups

