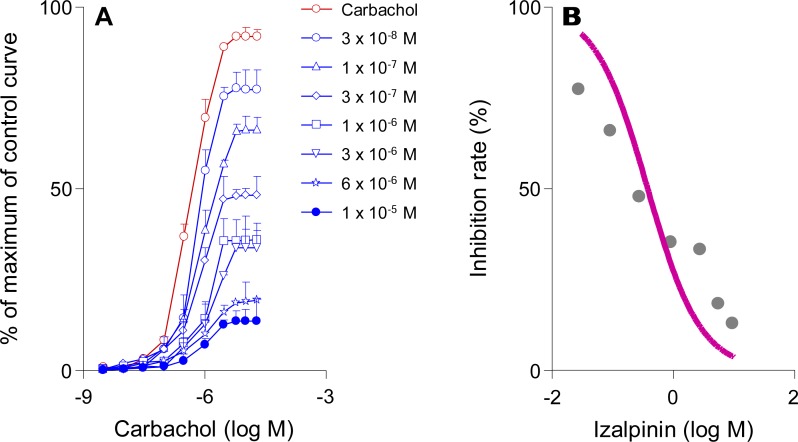
Figure 3.
Effects of izalpinin on the cumulative consecutive concentration-response curves to carbachol on isolated rat bladder detrusor strips. (A) The effects of izalpinin (30 nM−10 µM) on the carbachol concentration (3 nM−20 µM)-response curves are shown. (B) Dose-response relationship profile of izalpinin (30 nM−10 µM) against the carbachol at 10 µM. Direct contractile effects were expressed as percentages of the maximum response of the control curve. Data are expressed as means ± SD, n = 3–4 animals per concentration.

