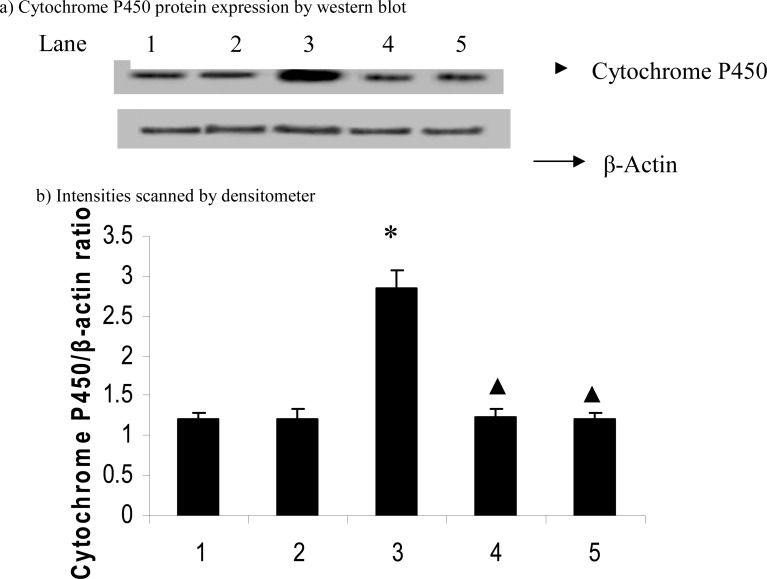
Figure 3.
Effect of carvacrol on cytochrome P450 protein expression in the liver of D-GalN-rats
Band intensities were expressed as ratio of cytochrome P450/β-actin and given as means ± S.D of three experiments. * P ≤ 0.05 compared with control rats; ▲ P ≤ 0.05 compared with hepatotoxic control rats. Lane: 1. Control; 2. Control + Carvacrol; 3. Hepatotoxic control; 4. Hepatotoxic + Carvacrol; 5. Hepatotoxic + Silymarin.

