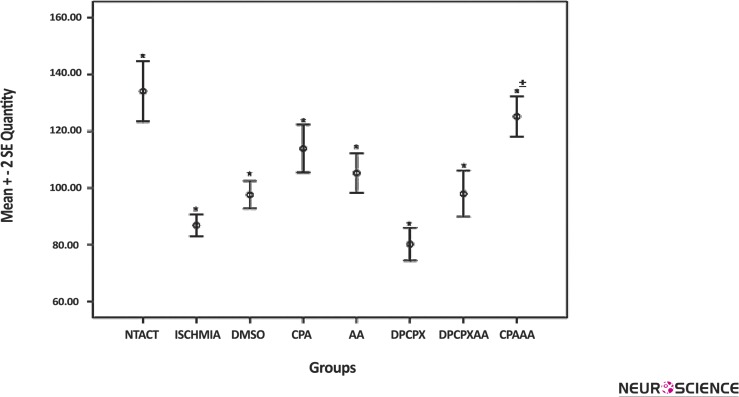
Figure 3.
Comparison of the normal cells density in the CA1 region of hippocampus
Values are shown as mean ± SEM. Cell density was measured by counting normal neurons in CA1 region using cresyl violet staining. Cell density in groups treated with CPA or vitamin C (shown with AA) is significantly increased compared to the ischemic group (*P < 0.05). The group named CPA/ AA, treated with both CPA and vitamin C showed a significant increase in density of normal cells in the CA1 region compared to the CPA or vitamin C (AA) groups (±P < 0.05).

