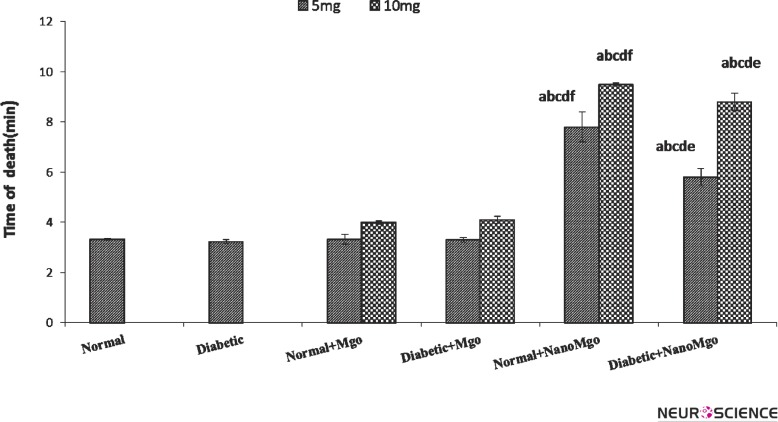
Figure 3.
Effects of nano and conventional MgO (5&10mg/kg) on death time (Mean ± SEM) in strychnineinduced convulsion at the normal and diabetic mice. (n = 7). The letters show significant difference between the groups (n = 7 and p < 0.05). a = Normal b = Diabetic c = Normal + cMgO d = Diabetic + cMgO e= Normal + nanoMgO f= Diabetic + nanoMgO

